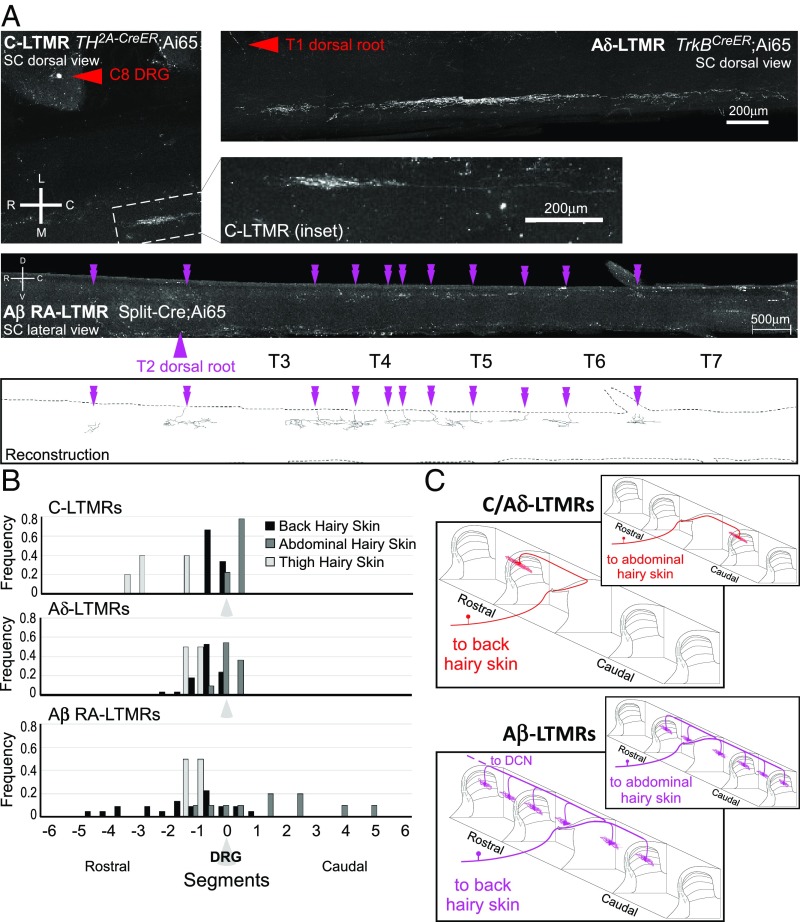
Fig. 6.
LTMR central projection display morphological differences according to body region innervated. (A) Representative images of whole-mount immunostained spinal cords showing LTMRs that innervate abdominal hairy skin. C-LTMRs were labeled using TH2A-CreER; Ai65 with 500 nL AAV1-Syn-FlpO injection into abdominal hairy skin at P7 and 0.5 mg tamoxifen at P21. Inset shows full central projection; red arrowhead labels corresponding soma in C8 DRG. Aδ-LTMRs were labeled using TrkBCreER; Ai65 with 250 nL AAV1-Syn-FlpO injection into abdominal hairy skin at P10 and 2 mg tamoxifen at P21. Red arrowhead labels corresponding axon entry (soma in T1 DRG). Aβ RA-LTMRs are labeled using Split-Cre; Ai65 with 200 nL AAV-Syn-FlpO injection into abdominal hairy skin at P10. Purple arrowhead indicates dorsal root of entry (soma in T2 DRG); double arrowheads denote collaterals in the spinal cord. Images are compressed z-projections. Scale, rostrocaudal (R, C), mediolateral (M, L), and dorsoventral (D, V) axes are indicated. Reconstruction for the Aβ RA-LTMR image is displayed. (B) Quantification of collateral location relative to soma-containing DRG, according to body region innervated (back hairy skin, black; abdomen hairy skin, dark gray; thigh hairy skin, light gray). C-LTMRs n = 17; Aδ-LTMRs n = 49; Aβ RA-LTMRs n = 5. (C) Schematic depicting unique central projection organization for LTMRs innervating back vs. abdominal hairy skin (not to scale).

