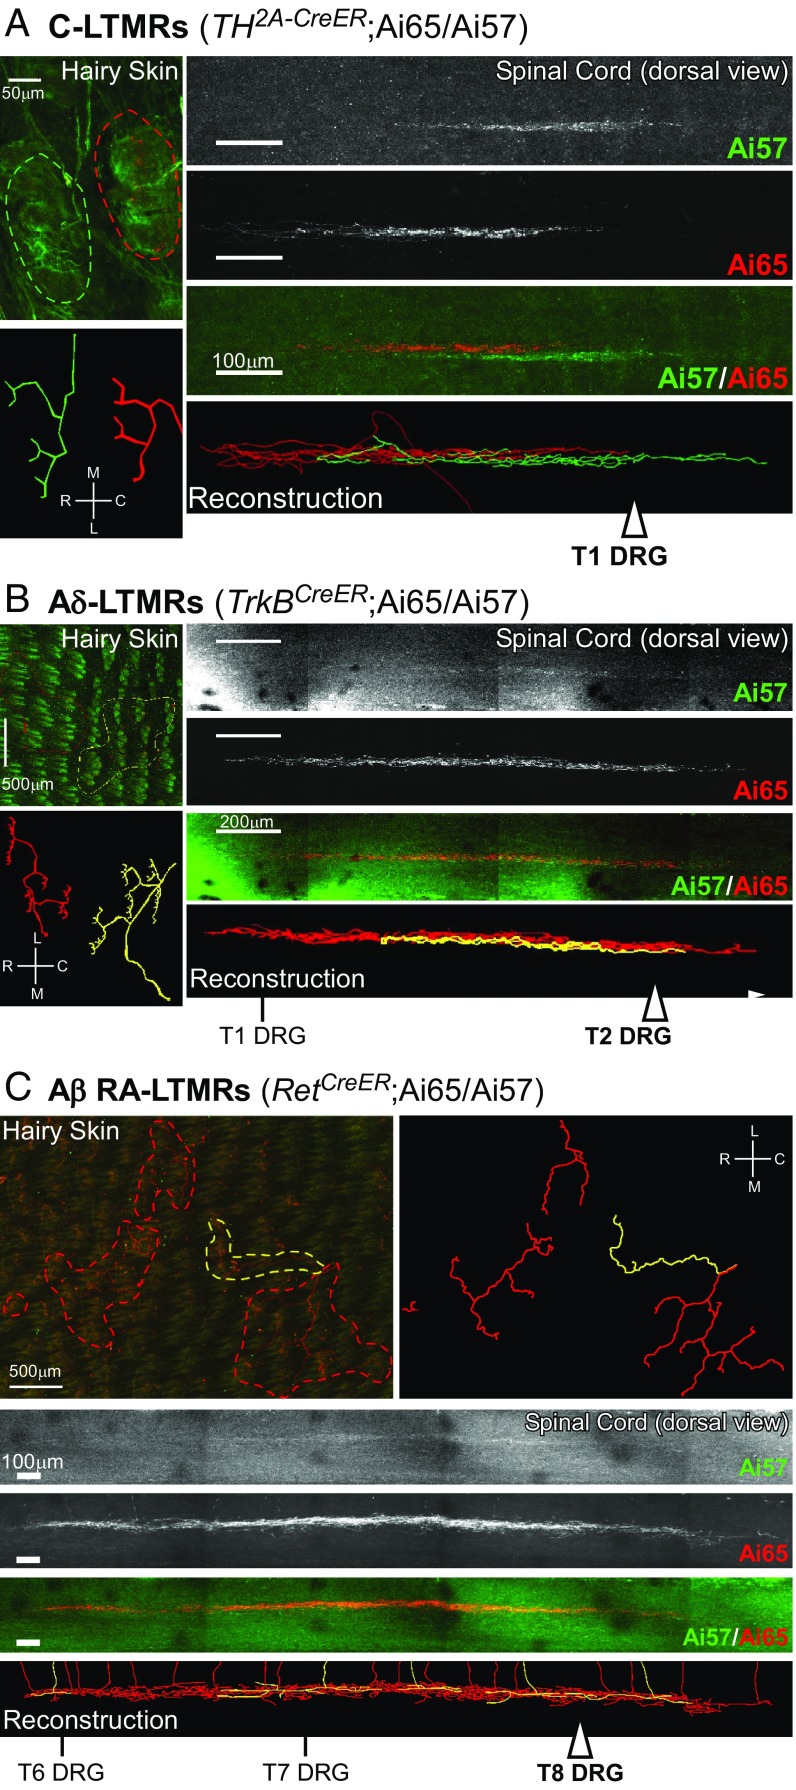
Fig. 7.
Central projection alignment and overlap patterns of homotypic LTMR subtypes. Representative images from back hairy skin and spinal cord whole-mount fluorescence staining. (A) C-LTMRs (n = 3 animals), for which a green neuron and a red neuron are labeled; (B) Aδ-LTMRs (n = 4 animals), for which a red neuron and a yellow neuron are labeled; and (C) Aβ RA-LTMRs (n = 3 animals), for which four red neurons and a yellow neuron are labeled. Injections of AAV1-Syn-FlpO virus into the skin of LTMR-CreER; Ai65/57 animals labeled a small number of LTMRs; individual LTMRs were labeled with tdTomato (Ai65), GFP (Ai57), or both reporters. See SI Appendix, Table S2 for AAV1-Syn-FlpO and tamoxifen dosages for targeting of each LTMR subtype. Outline of skin innervation patterns are depicted, in addition to reconstructions (SI Appendix, Experimental Procedures) to showcase innervation pattern. Reconstructions are also displayed for the spinal cord projections. White arrowheads mark dorsal root entry sites to the spinal cord for DRGs where corresponding cell bodies were located. Scale, as well as relative rostrocaudal (R, C) and mediolateral (M, L) axes, are indicated.

