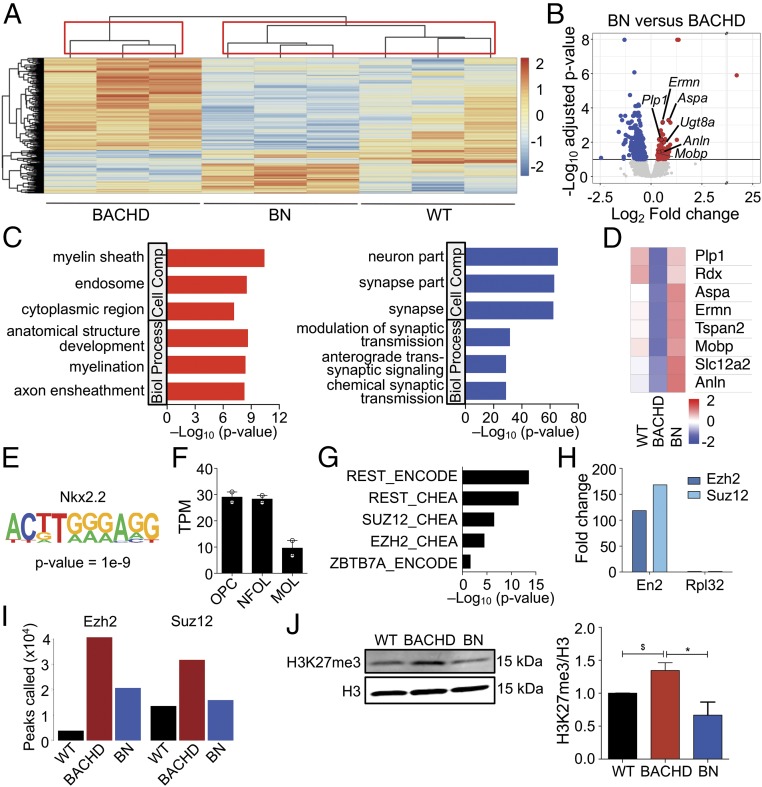
Fig. 3.
Epigenetic dysregulation mediates mHTT effects on oligodendroglia. (A) Heatmap and hierarchal clustering of the significantly differentially expressed genes between WT (n = 3), BACHD (n = 3), and BN (n = 3) (360 genes, 10% FDR likelihood ratio test). Red indicates higher gene expression, and blue represents lower gene expression. Boxes indicate clusters of samples determined by 10,000 bootstraps. (B) Volcano plot showing the differentially expressed genes between BN (n = 3) and BACHD (n = 3) mouse corpus callosum. The significant up-regulated genes with respect to BN are indicated in red, while the significant down-regulated genes are indicated in blue (FDR < 10%). (C) Gene ontology analysis of significant DEGs between BACHD and BN mice. The top three significant terms (FDR < 5%) for up-regulated and down-regulated genes are shown. (D) Heat map shows mean gene expression levels of selected genes in WT, BACHD, and BN mice. (E) Nkx2.2 appears as the top motif enriched in up-regulated DEGs between BACHD and BN. (F) Htt gene expression (fragments per kilobase million) in different stages of oligodendroglial differentiation (data from ref. 20; n = 2 for each group, and bars indicate mean). MOL, myelinating oligodendrocytes; NFOL, newly formed oligodendrocytes; OPC, oligodendrocyte progenitor cells. (G) REST and PRC2-binding sites are enriched in DEGs between BACHD and BN. (H) ChIP-qPCR enrichment at the En2 promoter in CC for EZH2 and SUZ12. Rpl32 was used as negative control. (I) Increased number of EZH2- and SUZ12-binding sites in the BACHD mice compared with WT is partially rescued in BN mice. (J) Immunoblot analysis of H3K27me3 in the CC of WT, BACHD, and BN mice. Values normalized to WT and presented as means ± SEM; n = 3 per genotype; *P < 0.05 by one-way ANOVA with Tukey’s post hoc test; $P < 0.05 by unpaired two-tailed t test.

