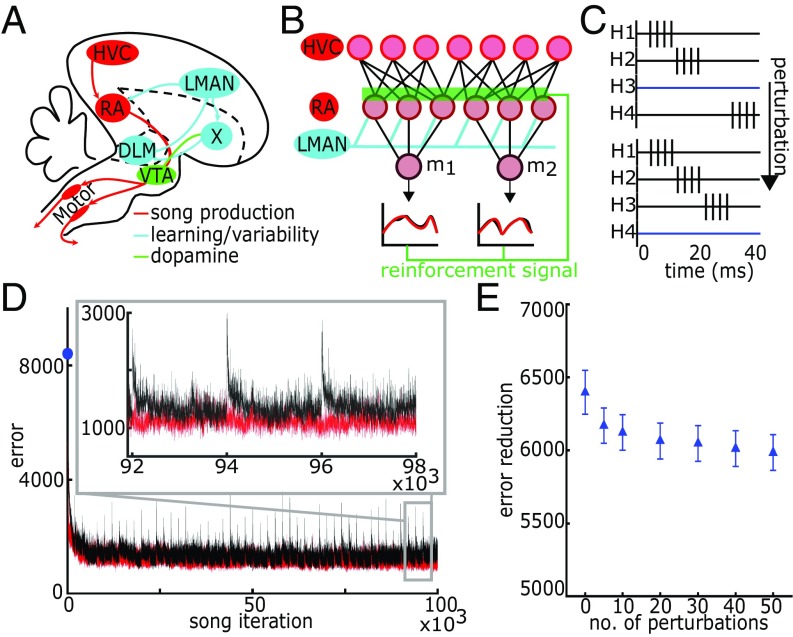
Fig. 1.
Model of bird song learning. (A) Schematic of the avian song system. (B) Schematic of learning model. Learning occurs on the synaptic weights from HVC (n = 500) to RA (n = 48). (C) Schematic of HVC firing patterns and perturbation events. (D) Learning trajectory. Error is defined as the absolute difference between the target m1 and m2 and the model output m1 and m2. Red trace shows unperturbed trajectory. Black trace shows trajectory with 50 HVC perturbation events. Blue dot on y axis indicates the error before learning. (Inset) Three perturbation events. (E) The difference between initial and final error in learning trajectory as a function the number of HVC perturbation events per 105 iterations averaged over 50 trials. Error reduction is defined as difference between the first iteration and average of the last 500 iterations for each trial. HVC perturbations slightly decrease error reduction. Error bars represent standard error.

