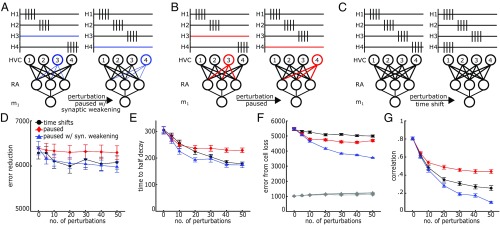
Fig. 4.
Model comparisons of perturbing HVC activity. (A) HVC perturbation scheme wherein a subset of HVC cells are silenced and reactivated at each perturbation event. Synapses weaken in silent cells. (B) The same scheme as in A, but without synaptic weakening. (C) HVC perturbation scheme wherein a subset of HVC cells’ firing times randomly shift at each perturbation event. (D–G) Comparison of performance and robustness metrics across perturbation schemes and frequency. (D) Error improvement over 105 iterations. Minor cost is incurred for increased perturbation frequency. (Same as in Fig. 1E.) (E) Number of iterations to half decay of relearning trajectory. (Same as in Fig. 2E.) (F) Increase in error due to RA cell loss. Gray indicates performance error with full RA network. Other colors indicate performance error with partial RA network. (Same as in Fig. 2B.) (G) Maximum pairwise correlations between HVC neurons’ synaptic projections to RA. Error bars represent standard error.

