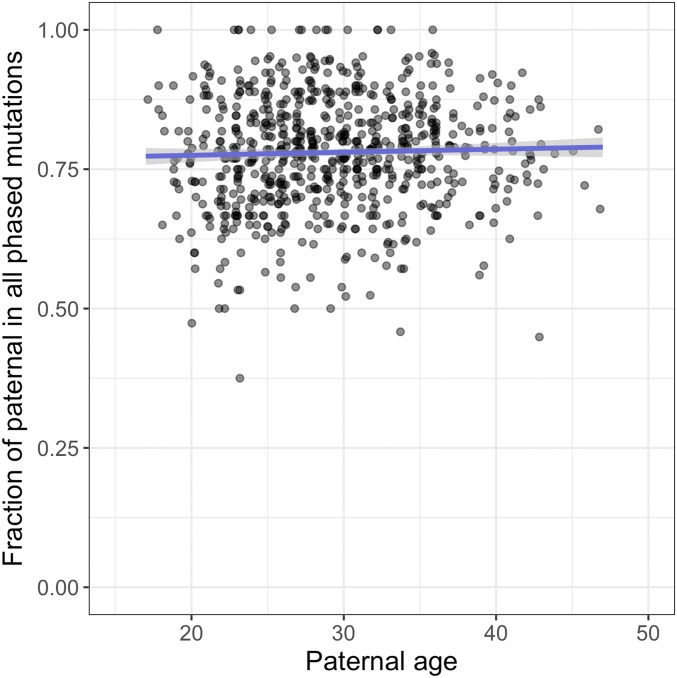
Fig. 1.
The fraction of paternal mutations among phased mutations, as a function of paternal age at conception. Each point represents the data for one child (proband) with similar parental ages (paternal-to-maternal age ratio between 0.9 and 1.1; 719 trios in total with a minimum of 6 and an average of 23.5 phased mutations per trio). The x-axis position, but not the y-axis position, is slightly jittered to show overlapping points. The blue line is the predicted fraction of paternal mutations by binomial regression with logit link, with the shaded area representing the 95% confidence interval (calculated with the “predict” function in R).

