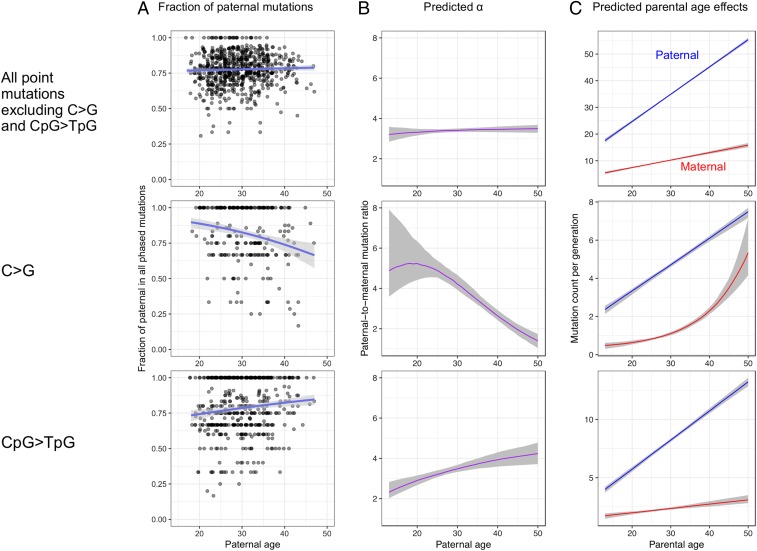
Fig. 3.
Distinctive sex and age dependencies for C > G and CpG > TpG DNMs. The shaded areas in all panels represent 95% CIs. See SI Appendix, Fig. S6 for similar plots for other mutation types. The male-to-female mutation ratio at age 17 is significantly lower for CpG > TpG than for other mutation types (discussed in the main text). (A) Fraction of paternal mutations in phased DNMs (similar to Fig. 1). (B) Predicted male-to-female mutation ratio (α). (C) Predicted parental age effects.

