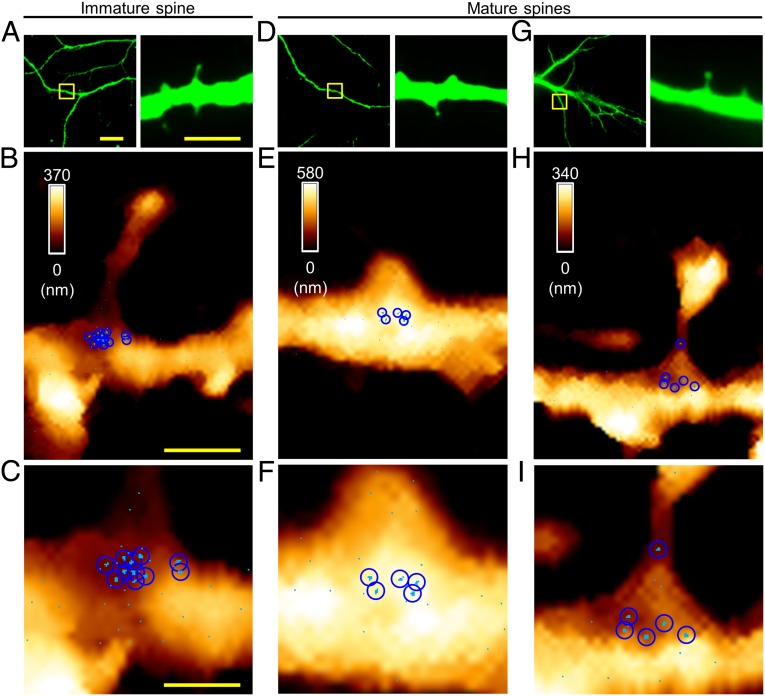
Fig. 2.
Visualization of miR-134s at individual spines. (A) Fluorescence images showing an immature spine (DIV14); the boxed area (Left) is shown at higher magnification (Right); MAP2, green. (B) AFM topographic image (3.0 × 4.0 μm2) of the boxed area in A and the force map showing individual miR-134/DNA hybrids. (C) Magnified force map of the dendritic shaft region in B. (D and G) Fluorescence images showing mature spines; the boxed areas (Left) are shown at higher magnification (Right). (E and H) AFM topographic images and overlaid force maps (3.0 × 4.0 μm2) of the boxed areas in D and G. (F and I) Magnified force maps in E and H; a sky-blue pixel represents a location where specific unbinding events were observed in more than two out of five measurements (pixel size, 10 nm); a blue circle indicates a cluster corresponding to the hydrodynamic radius observed at high resolution. [Scale bars: 20 μm (A, Left), 5.0 μm (A, Right), 1.0 μm (B), 0.50 μm (C). The scale bar for the fluorescence images in D and G is the same as that for the corresponding image in A; the scale bar for the AFM maps in E, F, H, and I is same as that for the corresponding maps in B and C.]

