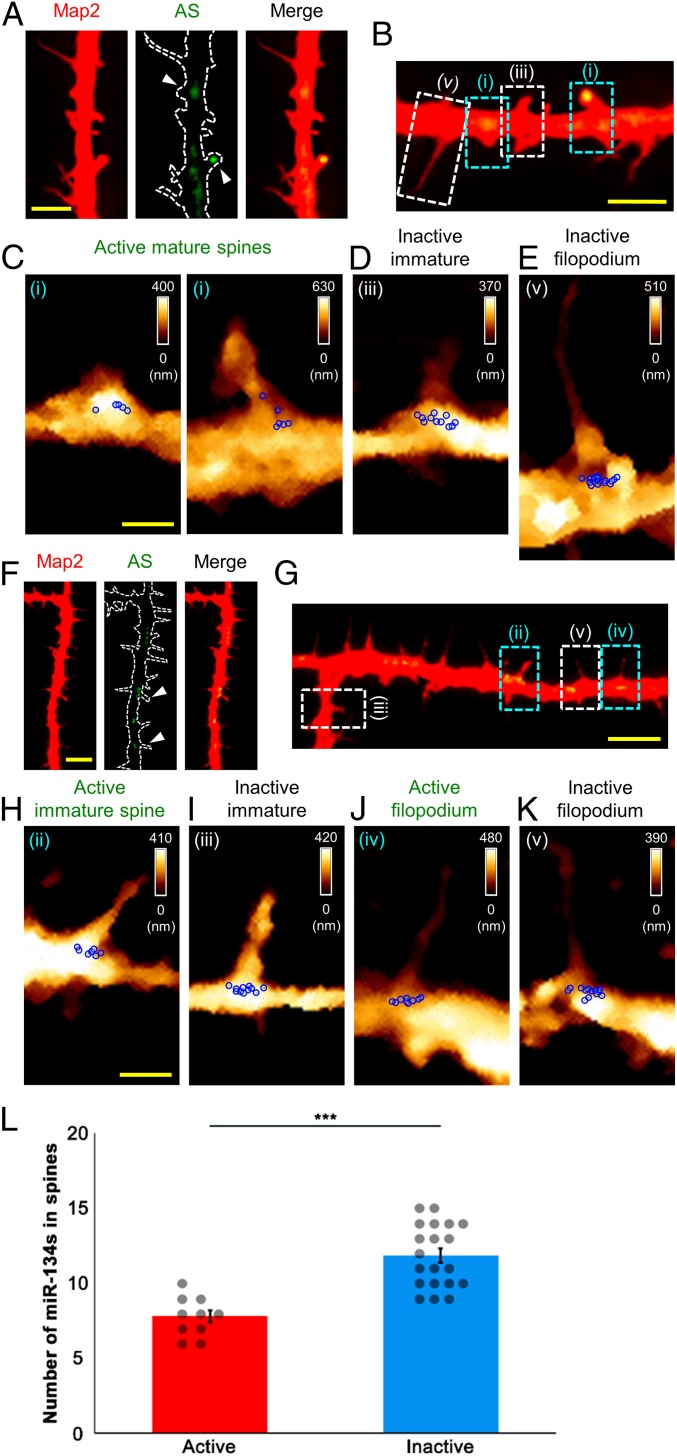
Fig. 3.
Mapping of miR-134s at spontaneously active filopodia and dendritic spines labeled with ArcMin-AS. (A, B, F, and G) Fluorescence images of filopodia and dendritic spines (DIV14); AS, ArcMin-AS. Each arrowhead indicates active filopodium and dendritic spines. (B and G) Active mature (i) and immature spine (ii) and filopodium (iv), and inactive immature spine (iii) and filopodium (v). (C–E and H–K); AFM topographic images and force maps were obtained for the boxed areas in B and G (3.0 × 5.0 μm2 or 3.0 × 5.5 μm2). (L) Numbers of miR-134s for active filopodia and immature spines vs. those for inactive filopodia and immature spines (two tailed t test, ***P < 0.001). [Scale bars: 20 μm (A and F), 5.0 μm (B and G), 1.0 μm (C and H). The scale bar for the AFM maps in D, E, I, J, and K are the same as those for the corresponding maps C or H.]

