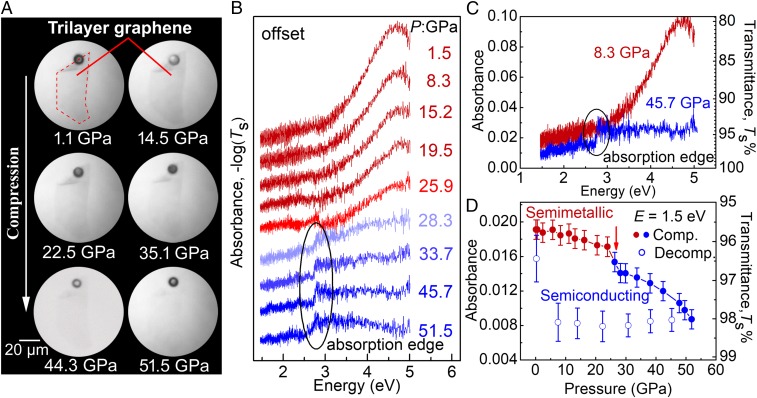
Fig. 4.
Bandgap opening in pressurized trilayer graphene. (A) The optical microscope image of trilayer graphene in transmission mode with a white-light source under compression. A ruby ball (black dot) was used as the pressure indicator and visual reference. (B) The optical absorbance patterns of trilayer graphene under compression. The curves are offset for clarity. (C) The absorbance of trilayer graphene at 8.3 and 45.7 GPa without offset. (D) Evolution of absorbance at a photon energy of 1.5 eV during compression and decompression.

