Fig. 5.
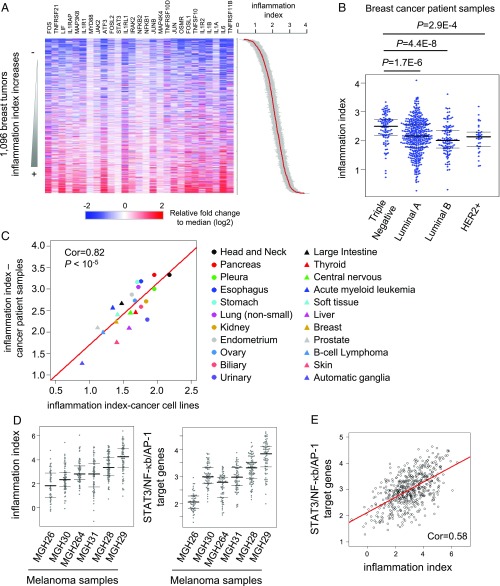
The inflammatory levels are variable among cancers with different developmental lineages and genetic subtypes. (A) Heatmap showing the relative expression levels of 27 genes in IL6/STAT3, IL1/NF-κb, and TNF/NF-κb pathways in breast cancer patient samples from the TCGA database. The samples were sorted by the cancer inflammation index (SEs shown in gray color). (B) Inflammatory indexes in genetic subtypes of breast cancer patients. (C) Correlation between inflammatory levels between cancer cell lines and patient tissue samples among different developmental lineages. The median cancer inflammation index value of patient samples from the same developmental lineage indicates its inflammatory level. (D) Inflammatory index and expression levels of of STAT3/NF-κb/AP-1 target genes using RNA-seq data from single cells from melanoma patient samples. Each point represents the expression from a single cell from the indicated tumor. (E) The correlation between inflammatory index and expression levels of target genes of STAT3/NF-κb/AP1 across single cells from melanoma patients.

