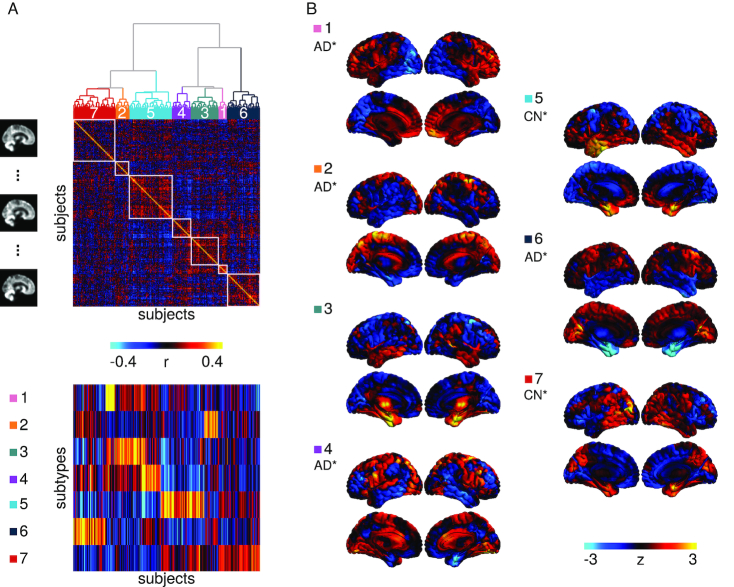
Figure 1:
Subtyping procedure and resulting subtypes. (a) A hierarchical clustering procedure identified 7 subtypes, or subgroups, of individuals with similar patterns of grey matter topography within the ADNI1 cohort of CN and AD participants (top). A measure of spatial similarity, called subtype weight, between a single individual's GMV map and the average of a given subtype was calculated for all individuals and all subtypes (bottom). (b) Maps of the 7 subtypes showing the distribution of grey matter across all voxels relative to the average. CN* and AD* denote significant associations between the subtype weights and diagnoses of CN or AD, respectively.

