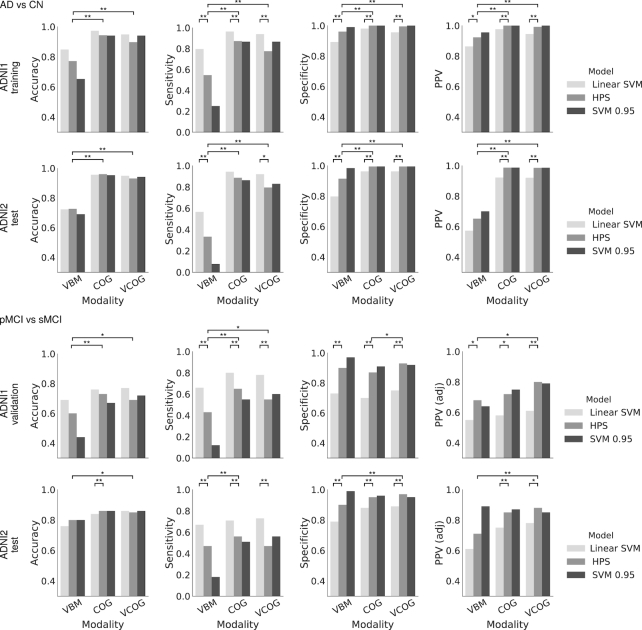
Figure 2:
Accuracy, specificity, sensitivity, and PPV for different classifiers: linear SVM, HPS, and the linear SVM thresholded at 0.95 (SVM 0.95), for the classifications of patients with AD and CN individuals and patients with MCI who progress to AD (pMCI) and stable MCI (sMCI) in ADNI1 and ADNI2. VBM represents the model trained with VBM subtypes, COG represents the model trained with baseline cognitive scores, and VCOG represents the model trained with both VBM subtypes and cognition. PPV was adjusted [PPV (adj)] for a prevalence of 33.6% pMCI in a sample of MCI participants for both ADNI1 and ADNI2 MCI cohorts. Significant differences are denoted by * for P < 0.05 and ** for P < 0.001.

