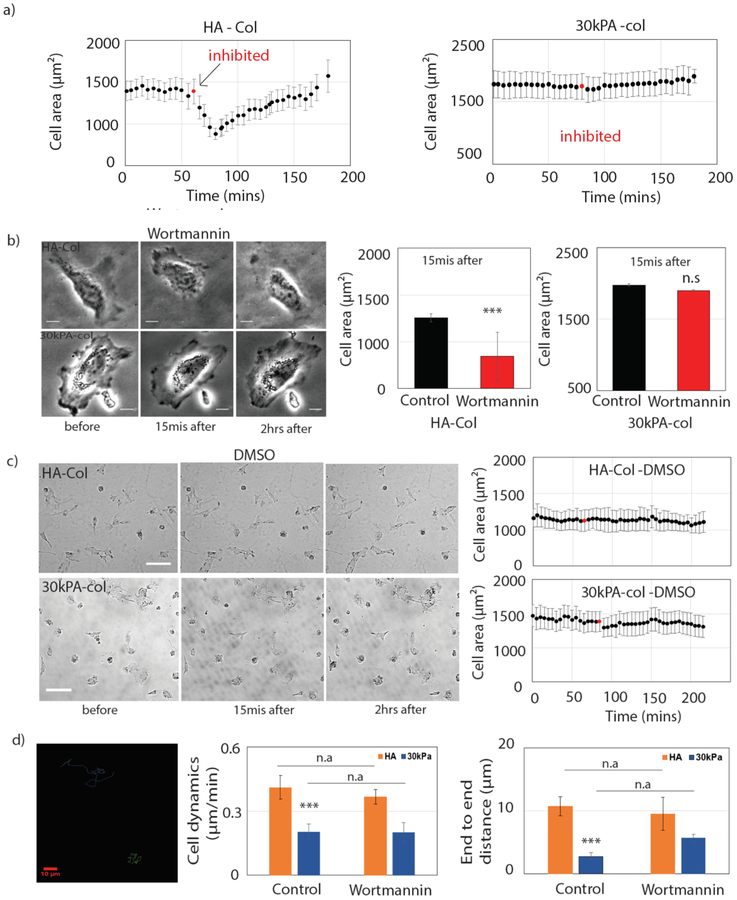
Figure2: Effect of PI3K inhibition in Huh7 cells by wortmannin.
Inhibition of PI3K in Huh7 cells grown on HA and 30 kPa. (a) Average cell area change is observed during 3 hrs of time period on both HA-col (left) and 30 kPa-col (right). PI3K is inhibited by wortmannin after 1h (red) of control imaging. (N=16 and 23 cells on HA and 30 kPa respectively). (b) (left) Bright field image of the cells before, 15mins after and 2 hrs after of adding wortmannin (Scale bar, 10 μm). (right) Cell area after 15 mins of wortmannin treatment are calculated. (c) (left) Bright field image of the cells before, 15mins after and 2 hrs after of adding DMSO (Scale bar, 100 μm). (right) Average cell area change over 3hrs time period shown in the figure (N=11 and 15 cells on HA and 30 kPa respectively). (d) (left) Cell dynamics have been shown by tracking the centroid of the cell on HA and 30 kPa substrates for both control and drug conditions. End to end distance are calculated by using initial and final centroid position of the cell. (N=16 and 23 cells on HA and 30 kPa respectively). All error bars represent standard error mean. P values are determined from Student’s t test for unpaired samples with respect to control cells (***P <0.0001; **P < 0.001; and *P <0.01).

