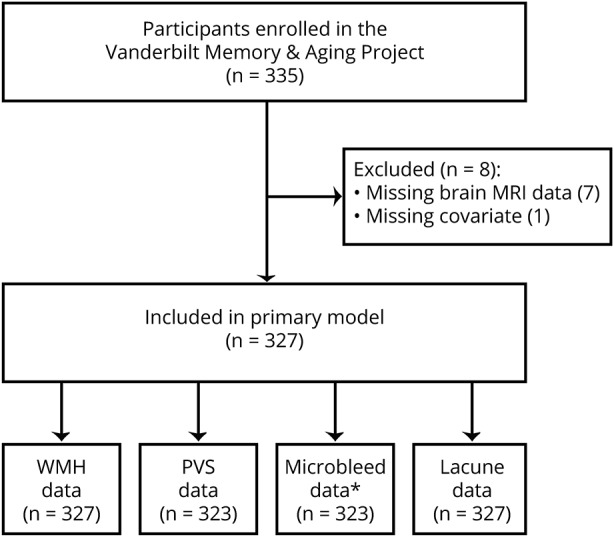
Figure 1. Participant selection details.

Missing brain MRI data include 7 participants for whom brain MRI was not performed. Missing covariate data include 1 participant missing left ventricular hypertrophy data required for Framingham Stroke Risk Profile calculation. Brain MRI data failing quality control (QC) includes 4 participants for whom susceptibility-weighted imaging (used to identify microbleeds) failed QC. Because of missing neuropsychological outcomes, each model ranged from n = 323 to n = 327. Secondary models required participants to have no missing data for all statistically significant predictors and thus included n = 327 (Wechsler Adult Intelligence Scale IV Coding, Delis-Kaplan Executive Function System [DKEFS] Number Sequencing, Hooper Visual Organization Test) or n = 322 (DKEFS Letter-Number Switching, DKEFS Color-Word Inhibition). PVS = perivascular space; WMH = white matter hyperintensity.
