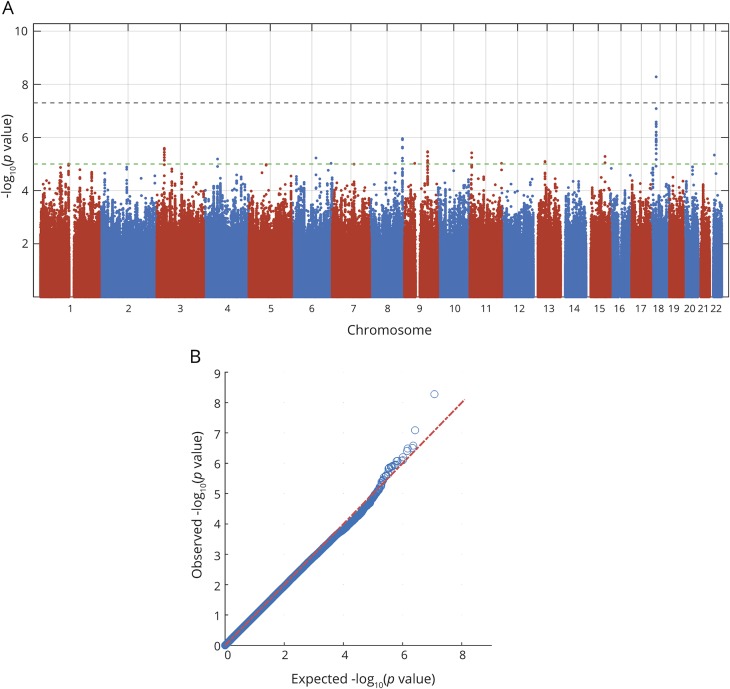
Figure 1. Manhattan and quantile-quantile plots of analysis for associations with dichotomized mRS at 3 months.
Outcome was measured as mRS 0–2 vs 3–6 at 3 months after ischemic stroke onset. Dotted lines show genome-wide significance (black, p <5 × 10⁻⁸) and suggestive association level (green, p < 10−5). Results are adjusted for age, sex, principal components, and baseline NIH Stroke Scale score. mRS = modified Rankin Scale.

