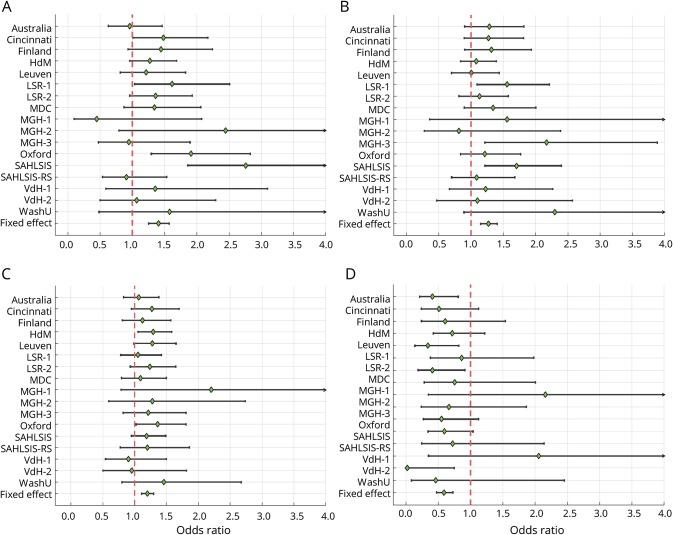
Figure 3. Forest plots for functional outcome at 3 months by study cohort.
The plots show ORs and 95% confidence intervals for minor allele of (A) rs1842681 (mRS 0–2 vs 3–6), (B) rs2236406 (mRS 0–2 vs 3–6), (C) rs13299556 (ordinal mRS), and (D) rs78734480 (ordinal mRS). ORs with effects above unity indicate a higher mRS score (worse outcome) per copy of the minor allele. Results are adjusted for age, sex, principal components, and baseline NIH Stroke Scale score. For cohort abbreviations, see data available from Dryad (table e-1, doi.org/10.5061/dryad.s38kf65). mRS = modified Rankin Scale; OR = odds ratio.

