Table 1.
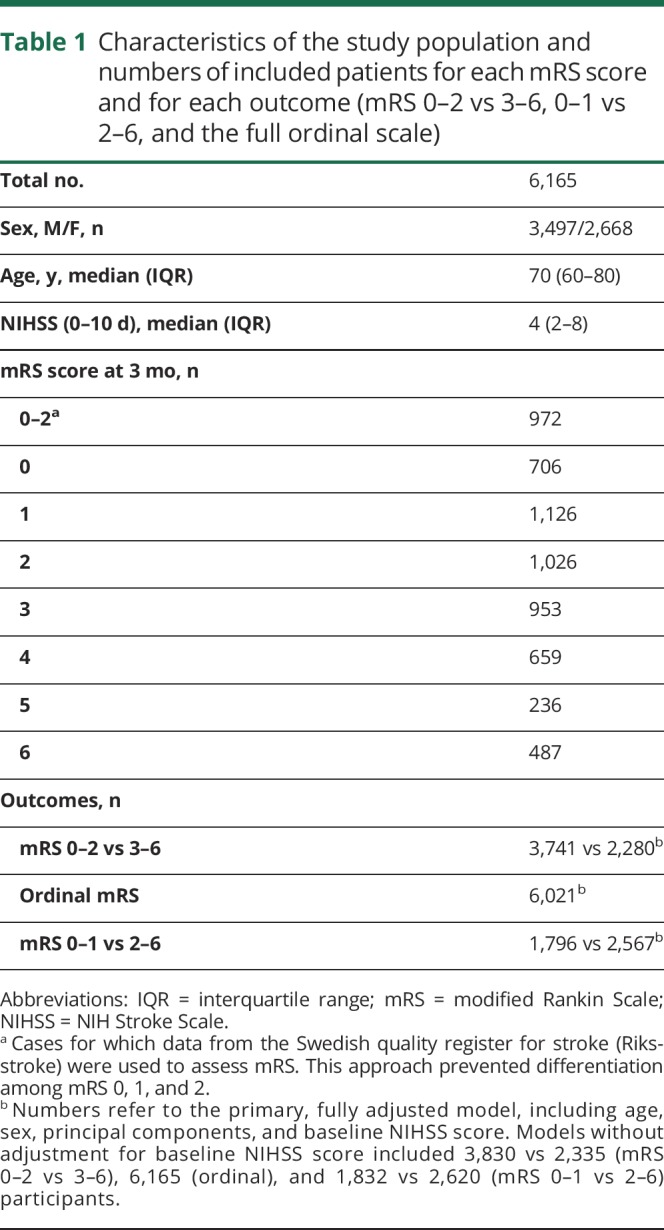
Characteristics of the study population and numbers of included patients for each mRS score and for each outcome (mRS 0–2 vs 3–6, 0–1 vs 2–6, and the full ordinal scale)

Characteristics of the study population and numbers of included patients for each mRS score and for each outcome (mRS 0–2 vs 3–6, 0–1 vs 2–6, and the full ordinal scale)
