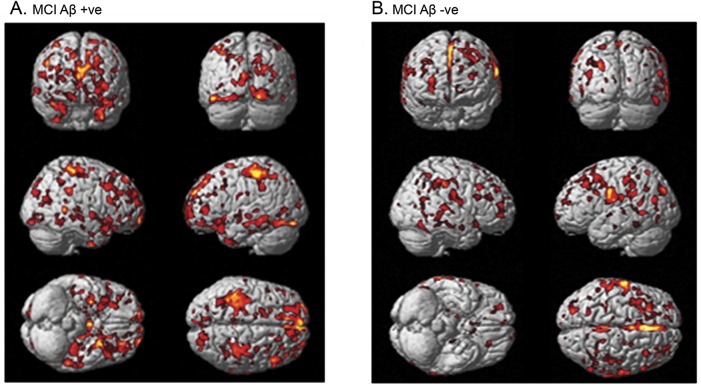
Figure 1. Biological parametric mapping correlation between [11C]PBR28 volume of distribution and gray matter volume.
Correlation between higher [11C]PBR28 and higher MRI gray matter density in (A) amyloid-positive patients with MCI and (B) amyloid-negative patients with MCI. Aβ = β-amyloid; MCI = mild cognitive impairment.

