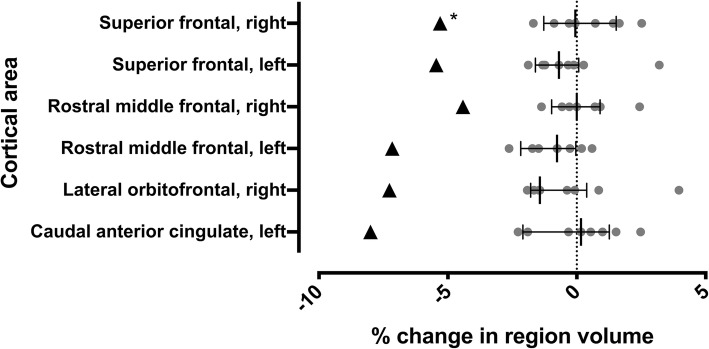
Fig. 1.
Proportional change of cortical region volume from baseline to 9-month follow-up period. The case is denoted by black triangles (▲), while grey dots (●) are reference subjects. The median value of all subjects is denoted by a vertical black line. Error bars represent the upper and lower quartiles. *: cortical volume reduction = 1.42xIQR

