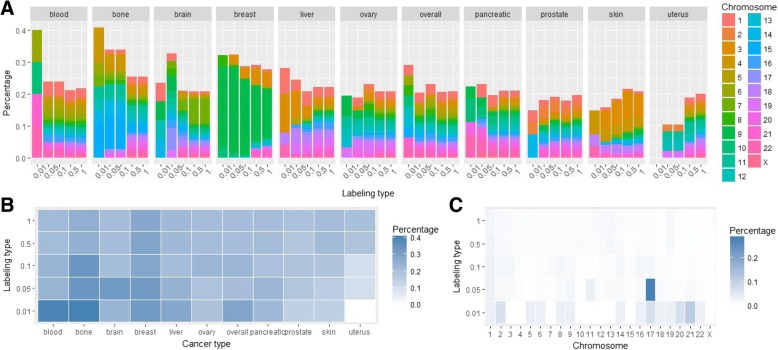
Fig. 2.
a Percentage of breakpoint hotspots intersecting with whole gene regions in different cancer types for 5 different hotspot labeling types. b Heatmap of the percentage of the breakpoint hotspots’ intersections with whole gene regions across different cancer types. c Heatmap of the percentages of all breakpoint hotspots’ intersections in all cancer types stratified by different chromosomes

