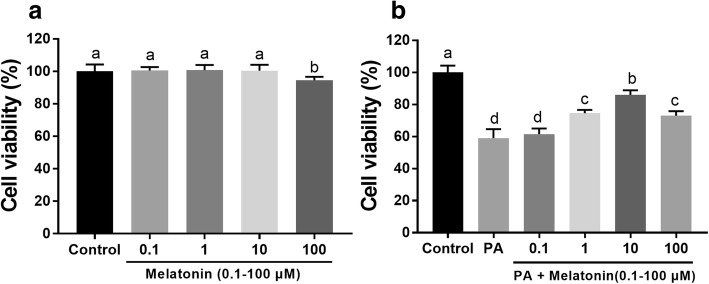
Fig. 5.
Effects of melatonin on PA-induced mouse granulosa cell activity. a Cells were treated with different concentrations of melatonin (0.1-100 μM) for 24 h and then processed for cell activity analysis. b Cells were treated with different concentrations of melatonin (0.1-100 μM) and 400 μM PA for 24 h. Data are presented as the mean ± SEM of three independent experiments. Bars with different letters are significantly different (p < 0.05)

