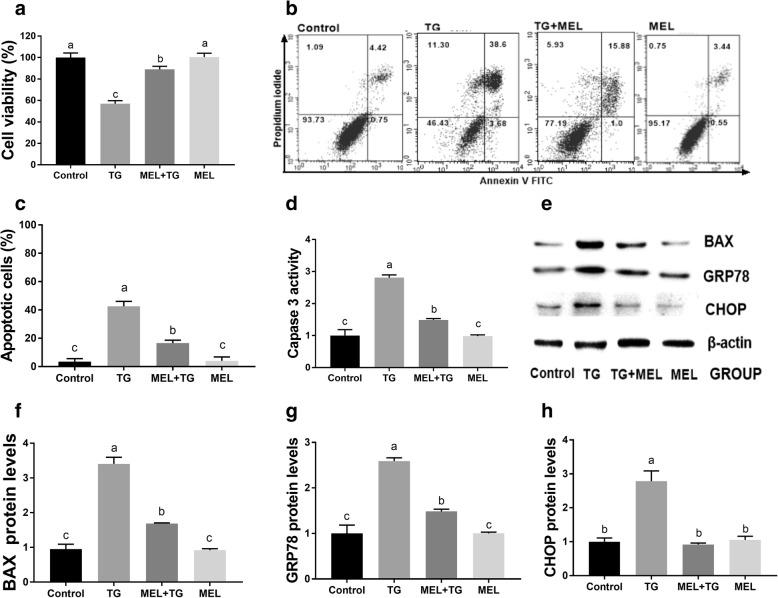
Fig. 9.
Effects of melatonin on TG-treated mouse granulosa cell viability, cell apoptosis and ER stress at 24 h. a Cell viability measured by an MTT assay. b, c Apoptosis detected via flow cytometry. d Western blot assays of BAX, GRP78 and CHOP expression. e Caspase 3 activity of H9C2 cells. f Relative BAX expression. g Relative GRP78 expression. h Relative CHOP expression. The protein expression levels were normalized to the β-actin level. PA: 400 μM palmitic acid; TG: 500 nM thapsigargin; MEL: 10 μM melatonin; 4P: 500 nM 4-PBA. The statistical analysis results are shown in the bar graphs. Data are presented as the mean ± SEM of three independent experiments. Bars with different letters are significantly different (p < 0.05)

