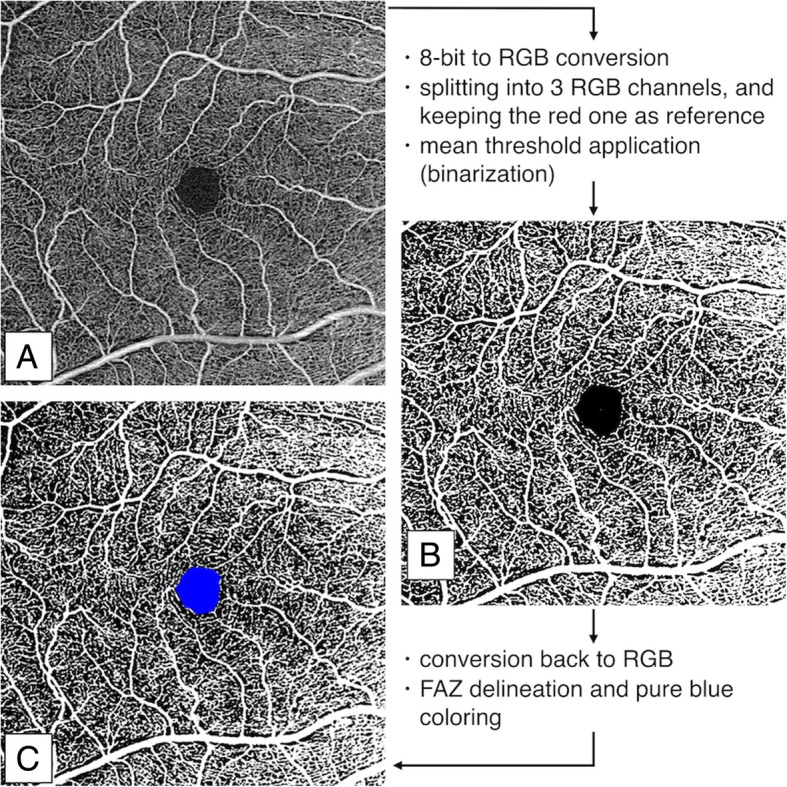
Fig. 2.

Diagram showing the image analysis procedure of an optical coherence tomography angiography (OCT-A) scan. Binarization example of a 6 × 6 mm OCT-A scan of the superficial capillary plexus of vitreomacular traction (a). The procedure consists of (i) 8-bit to red-green-blue (RGB) color-type conversion; (ii) splitting into three channels (RGB) and keeping open the red one as reference; (iii) applying of a mean threshold to convert the image from gray-scale to binary scale (b); (iv) re-converting the processed images to RGB; (v) delineating the FAZ area and coloring it with pure blue. After this elaboration (c), white pixels represent perfused vessels, black pixels are the background (non-perfused), and blue pixels are automatically excluded from the analysis
