
Fig. 6.
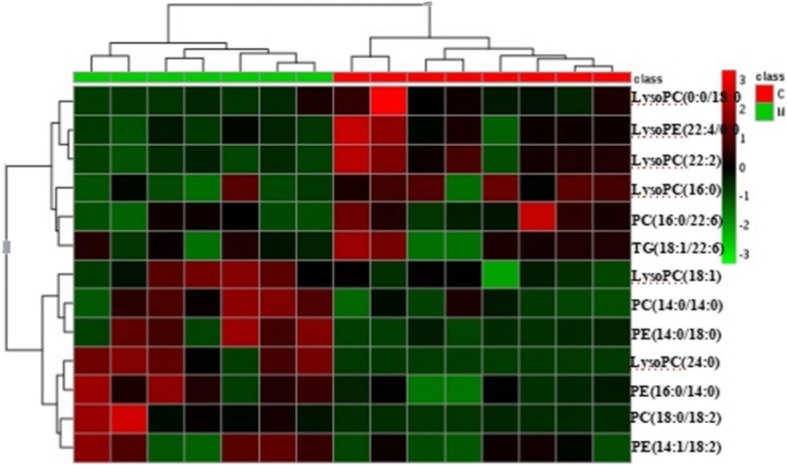
The expression profiles of the 13 lipids in each sample. Hierarchical clustering analysis of the 13 lipids dysregulated between control and model group. For class name, red represents control group and green represents model group. For the expression level of each lipid, red represents high and green represents low