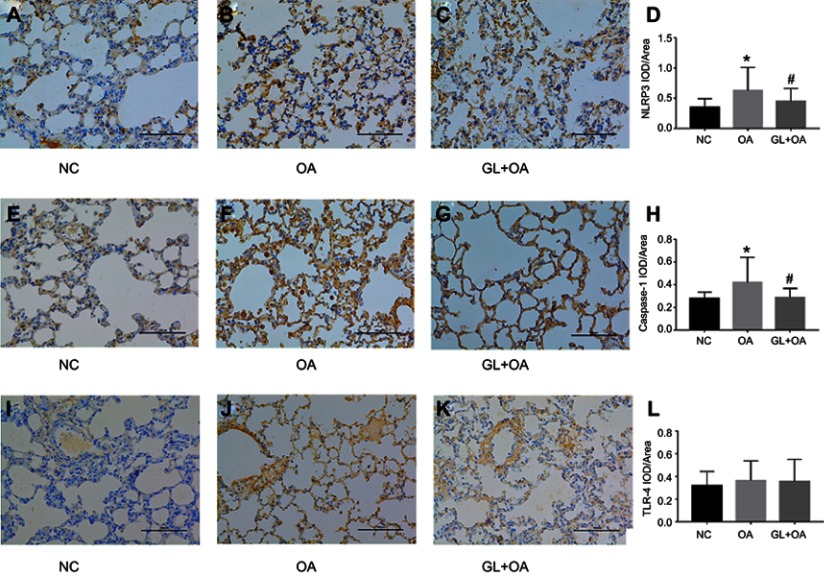
Figure 3.
NLRP3 and caspase-1 expression in three groups by IHC. (A, E and I) control group; (B, F and J) OA group; (C, G and K) GL+OA group. (A–D) NLRP3 and (E–H) caspase-1 staining intensities were strongest in OA group, attenuated in GL+OA group and weakest in control group. *P=0.000 (D), *P=0.000 (H), OA group versus NC group. #P=0.013 (D), #P=0.000 (H), GL+OA group versus OA group. (I–L) TLR4 staining intensity was not changed obviously in three groups (P=0.277).
Abbreviations: NC, negative control; OA, oleic acid; GL, glibenclamide, IHC, immunohistochemical analyses.

