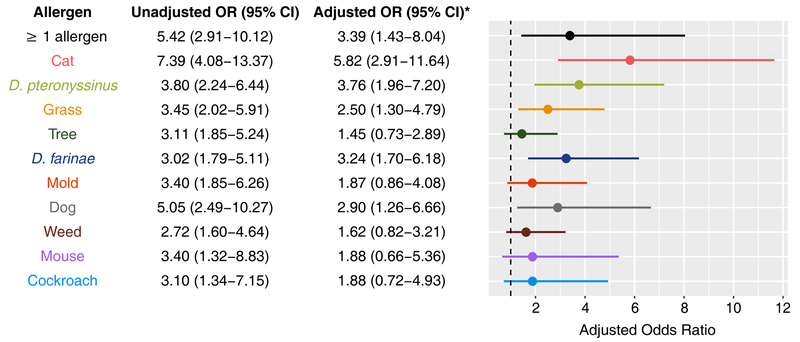
Figure 4. Odds of Actual Sensitization Given Perceived Sensitization to Individual Aeroallergens.
Multivariable logistic regression models were built to estimate odds ratios for actual sensitization (sIgE ≥ 0.35 kUA/L) given perceived sensitization to individual aeroallergens, adjusted for potential confounders including age, sex, race, season of enrollment, allergic rhinitis, asthma, and family history of atopy. Unadjusted and adjusted ORs are shown, with the forest plot displaying adjusted odds ratios and their 95% confidence intervals for each aeroallergen.

