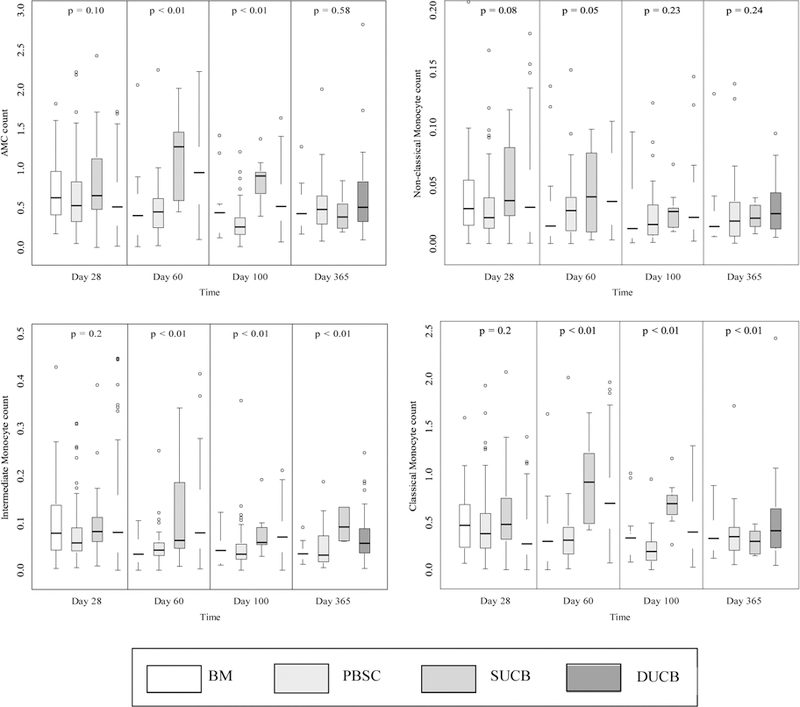
Figure 2.
Monocyte subpopulation recovery (×109/L) post-HCT, by stem cell source and day.1

1The box shows the interquartile range with the bottom and top indicating the 25th and 75th percentiles; the thick line inside the box indicating the median; the whiskers representing 1.5 times of the height of the box (or minimum/maximum values if there is no value in that range); and the circle indicating the outliers.
