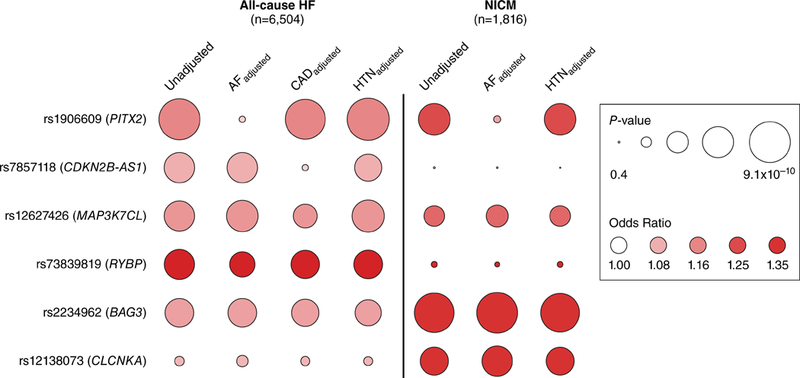
Figure 3. Association of suggestive all-cause heart failure and nonischemic cardiomyopathy variants adjusted for known heart failure risk factors.

Logistic regression was used to test the association of lead variants identified at suggestive loci (P < 1×10⁻⁶) for either all-cause heart failure or nonischemic cardiomyopathy against both endpoints adjusted for baseline atrial fibrillation, baseline coronary artery disease, and baseline hypertension. Nonischemic cardiomyopathy testing was not adjusted for coronary artery disease as coronary artery disease was an exclusion criteria. All analyses were additionally adjusted for age at baseline, sex, genotyping array, and the first 10 principal components of ancestry. Circle size denotes P-value and shading represents the odds ratio for a 1-allele increase of the all-cause heart failure/nonischemic cardiomyopathy risk allele. Abbreviations: HF=heart failure; NICM=nonischemic cardiomyopathy; AF=atrial fibrillation; CAD=coronary artery disease; HTN=hypertension.
