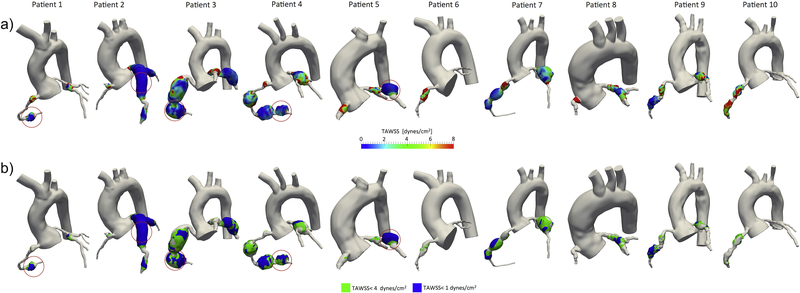
Figure 1.
a) Local coronary artery aneurysm spatial distribution of time-averaged wall shear stress (TAWSS) obtained from computational simulations. Thrombosed coronary artery aneurysms are circled in red, showing correspondence between localized low TAWSS and thrombosis. b) Low wall shear stress exposure computed locally at each coronary artery aneurysm. Thrombosed coronary artery aneurysms are circled in red, larger aneurysm surface area exposed to low wall shear stress (TAWSS < 3 dynes/cm2, TAWSS < 1 dynes/cm2) is correlated with thrombosis locations.

