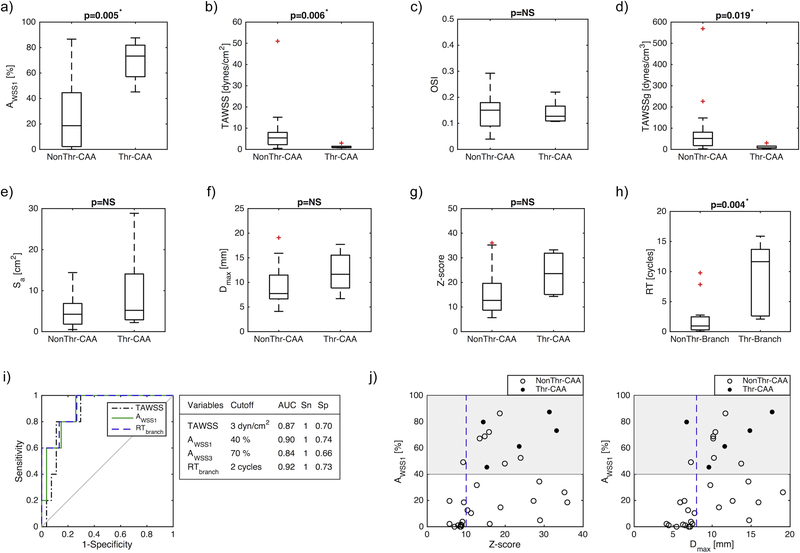
Figure 2.
Analysis of hemodynamic and geometric parameters for thrombosed and non-thrombosed CAAs and branches: a) low wall shear stress exposure (AWSS1 = area exposed to TAWSS < 1 dyne/cm2), b) time-averaged TAWSS, c) oscillatory shear index (OSI), d) time-averaged wall shear stress gradient (TAWSSg), e) aneurysm surface area (Sa), f) maximum aneurysm diameter (Dmax,) g) Z-score and h) residence time (RT), i) ROC curves and cutoff values for time-averaged wall shear stress (TAWSS) (AUC = 0.87), low wall shear stress exposure (AWSS1) (AUC = 0.9), and residence time (RT) (AUC = 0.92), j) Comparison between low shear stress exposure (AWSS1) and geometric variables. CAA = Coronary artery aneurysm; NonThr = No confirmed thrombosis; Thr = Confirmed thrombosis; AUC=Area under the curve, Sn = Sensitivity; Sp = Specificity

