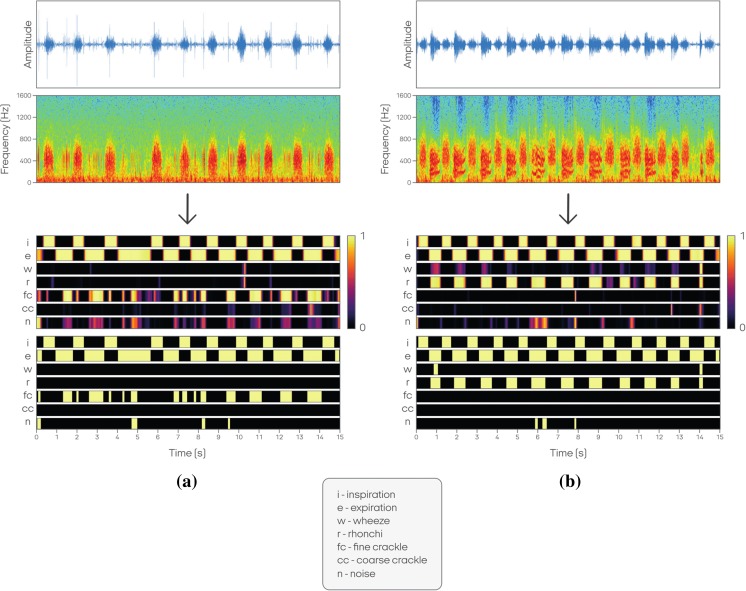
Fig. 3.
Exemplary probability raster for fine crackles (a) and rhonchi (b): the signal (first line) is transformed into a spectrogram (second line) and analyzed by the NN. The output of the NN is presented as bidimensional matrix, called a probability raster (third line). The rows in the matrix represent time, framed in windows of 10 ms each; the columns show the probability of positive detection of each phenomenon. The raster is eventually post-processed to obtain boolean values indicating the presence or absence of phenomena for each frame (the fourth line)

