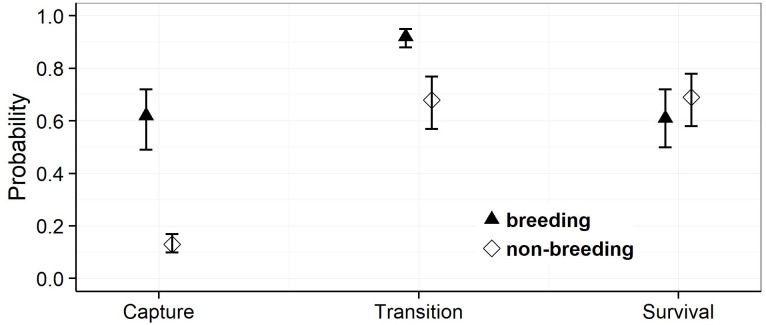
Figure 3. Estimates of the mean capture, transition and survival probabilities in breeding and non-breeding females.
Mean estimates (symbols) as obtained by weighted averaging over the model set listed in Table 1, part (c). The vertical lines show the 95% confidence intervals.

