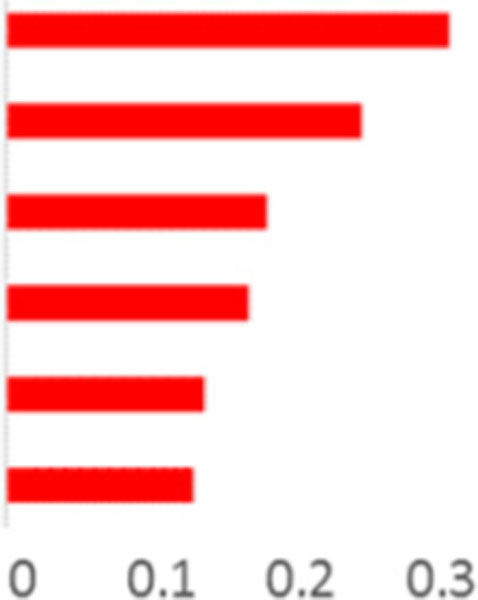
Table 3.
Putatively-identified molecules that discriminate serotype 14 from serotypes 6B, 15, 18C, 19F, 9V and 23F.
| Putative Peak Identification | Retention Index (RI)1 | Retention Time 2 (Seconds) |
Average MS Similarity4 |
Log2(Serotype 14/Other Serotypes) |
||
|---|---|---|---|---|---|---|
| Experimental2 | Literature3 | |||||
| 2,3-Pentanedione | 736 | NA | 1.0 | 920 |  |
|
| Benzaldehyde | 1030 | 1036 | 1.3 | 839 | ||
| 2-methylbutanal | 703 | NA | 0.8 | 860 | ||
| 3-hydroxybutan-2-one | 779 | NA | 1.6 | 840 | ||
| Cyclic hydrocarbon compound | 736 | NA | 1.1 | <800 | ||
| 2-methylpropanal | 779 | NA | 0.8 | 903 | ||
NA: not applicable because no RI available.
Retention indices of target analytes compared to values reported in the literature are used to further confirm putative peak identifications.
Retention index of each analyte was calculated based on its first dimension retention time with respect to alkane standards.
Retention index of pure analytical standards were extrapolated from values reported in the literature [35].
Average MS similarity was calculated by ChromaTOF software by comparing the mass spectra of each analyte to the mass spectra of compounds in the NIST 2011 library. Similarity scores are out of 1000.
