
Fig. 1.
HLA-DR expression in monocyte and dendritic cell subsets in the different cohorts.
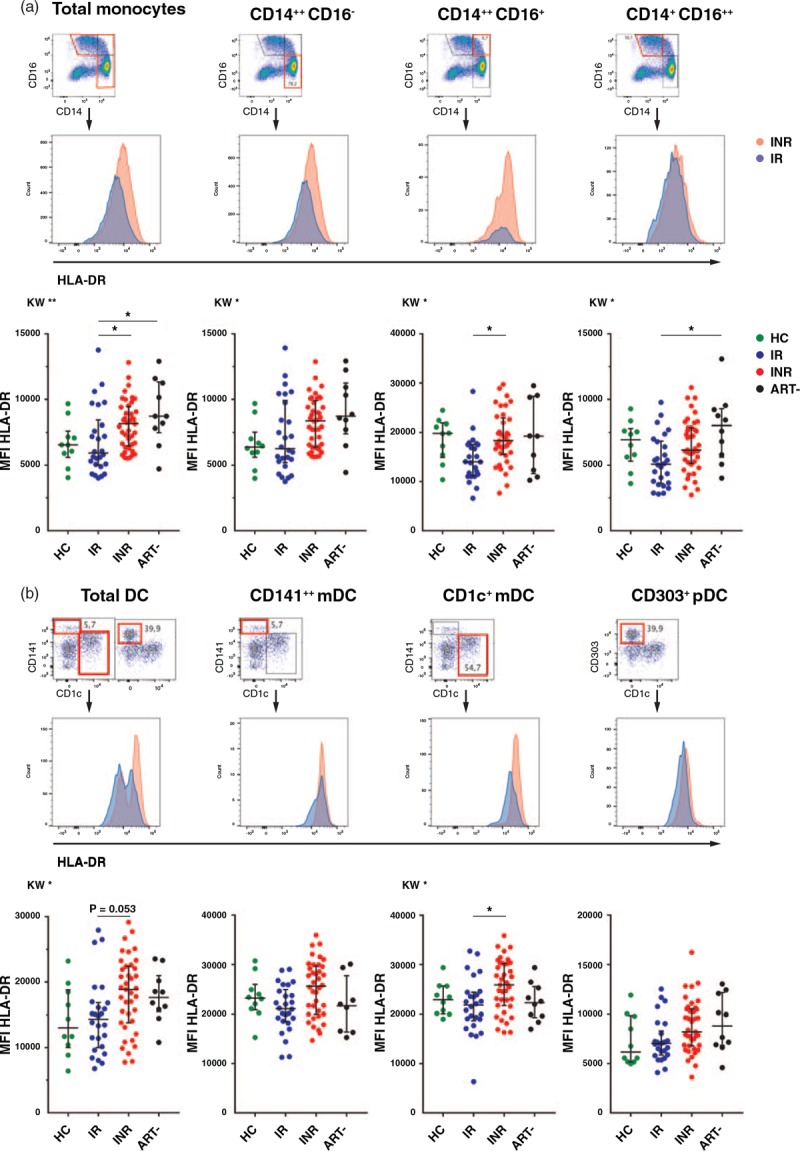
Parts (a) and (b) show overlay plots of median fluorescence intensity of HLA-DR in one immunological nonresponder and one immunological responder for various monocyte and dendritic cell subsets, respectively. The graphs display the differences among healthy control, immunological responder, immunological nonresponder and antiretroviral therapy-naive groups in the HLA-DR expression in the specific monocyte (a) and dendritic cell (b) subsets. Kruskal–Wallis test followed by Dunn's post-hoc test for correction for multiple comparisons. ∗P < 0.05, ∗∗P < 0.01, ∗∗∗P < 0.001. Lines indicate median and interquartile range. ART-, antiretroviral therapy naive HIV-infected; DC, dendritic cells; HC, healthy control; INR, immunological nonresponder; IR, immunological responder; MFI, median fluorescence intensity.