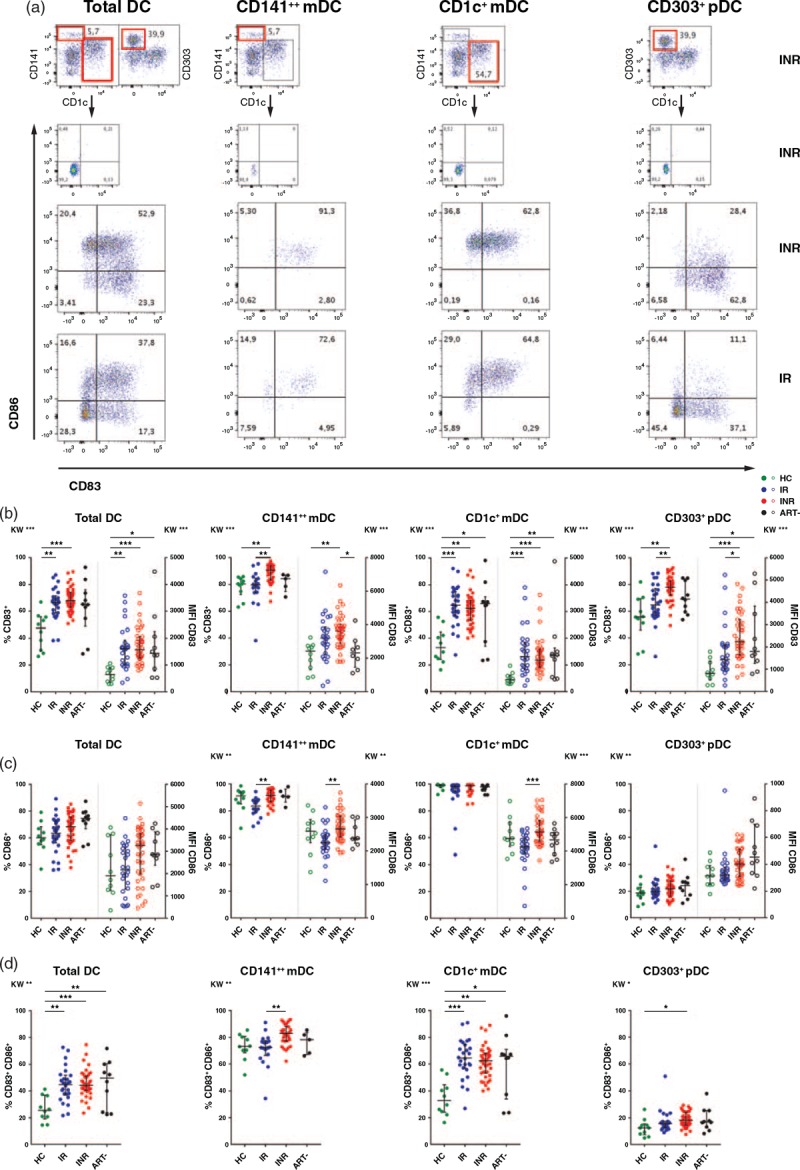
Fig. 2.
Dendritic cell activation markers in the various groups.

Part (a) illustrates gating strategy of dendritic cell activation markers based on isotype or fluorescence minus one in total dendritic cells and the different dendritic cell subsets. The plots show representative examples from one immunological nonresponder and one immunological responder. In parts (b), (c) and (d), the graphs display both percentage (solid dots) and median fluorescence intensity (open dots) values of the activation markers CD83, CD86 and the coexpression of CD83 and CD86 in the various dendritic cell subsets for each group. Kruskal–Wallis test followed by Dunn's post-hoc test for correction for multiple comparisons. ∗P < 0.05, ∗∗P < 0.01, ∗∗∗P < 0.001. Lines indicate median and interquartile range. ART-, antiretroviral therapy naive HIV-infected; DC, dendritic cells; HC, healthy control; INR, immunological non-responder; IR, immunological responder; MFI, median fluorescence intensity.
