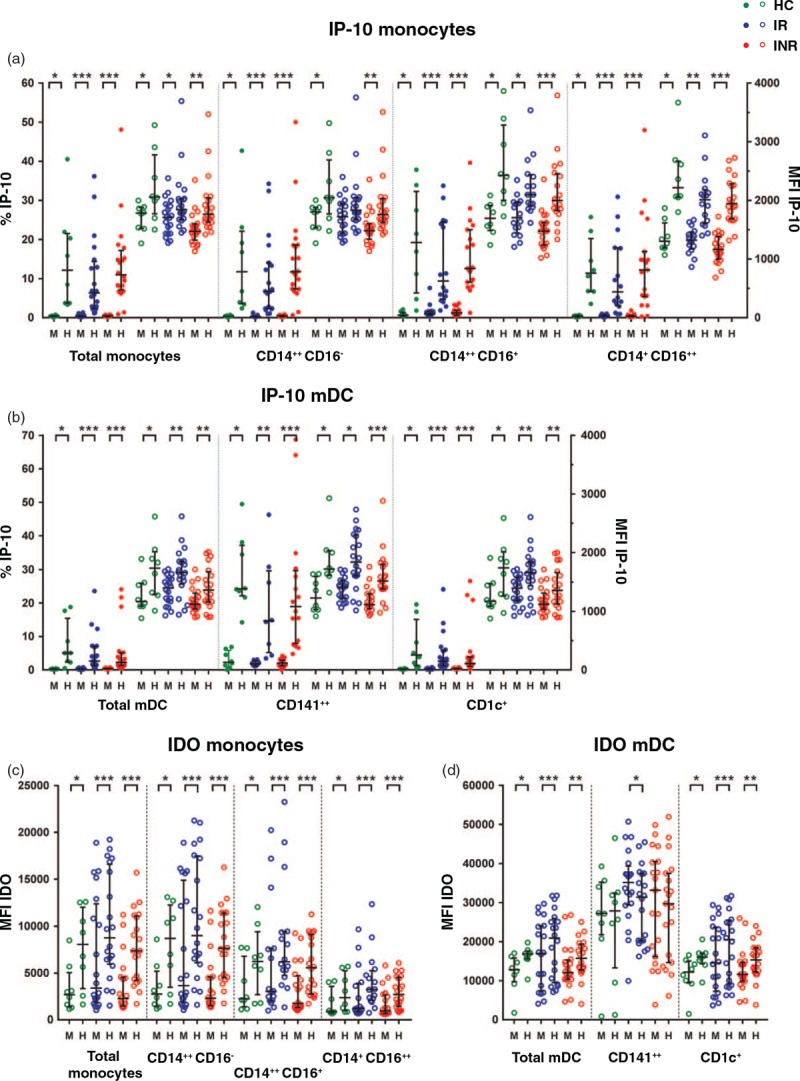
Fig. 3.
Interferon-inducible protein-10 and indoleamine 2,3-dioxygenase responses in monocytes and myeloid dendritic cells after exposure to aldrithiol-2 inactivated HIV-1 in vitro.

Percentages (solid dots) and median fluorescence intensity (open dots) of interferon-inducible protein-10 in monocytes (a) and myeloid dendritic cells (b) after in-vitro stimulation of peripheral blood mononuclear cells with either mock (M) or aldrithiol-2 inactivated HIV-1 (H) in healthy controls, immunological responders and immunological nonresponders. Parts (c) and (d) display indoleamine 2,3-dioxygenase responses in monocytes and myeloid dendritic cells, respectively. Wilcoxon test for pairwise comparisons between mock and aldrithiol-2 inactivated HIV-1 stimulation.∗P < 0.05, ∗∗P < 0.01, ∗∗∗P < 0.001. Lines indicate median and interquartile range. HC, healthy control; INR, immunological nonresponder; IR, immunological responder; mDC, myeloid dendritic cell; MFI, median fluorescence intensity.
