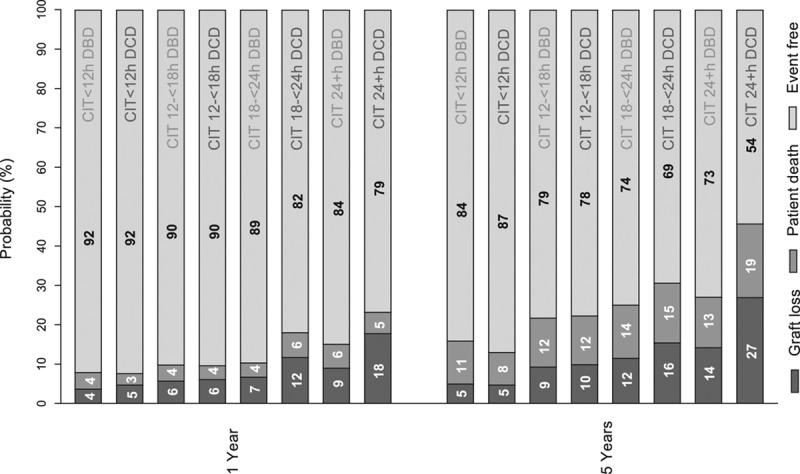
FIGURE 3.

One-year and 5-y graft survival by donor type (brain death and circulatory death donor kidneys) and CIT categories (<12, ≥12<18, ≥18<24, and ≥24 h). Graft events are shown as (1) graft loss and return to dialysis, (2) patient death, or (3) alive, with functioning graft. Results are unadjusted. CIT, cold ischemia time; DBD, donation after brain death; DCD, donation after circulatory death.
