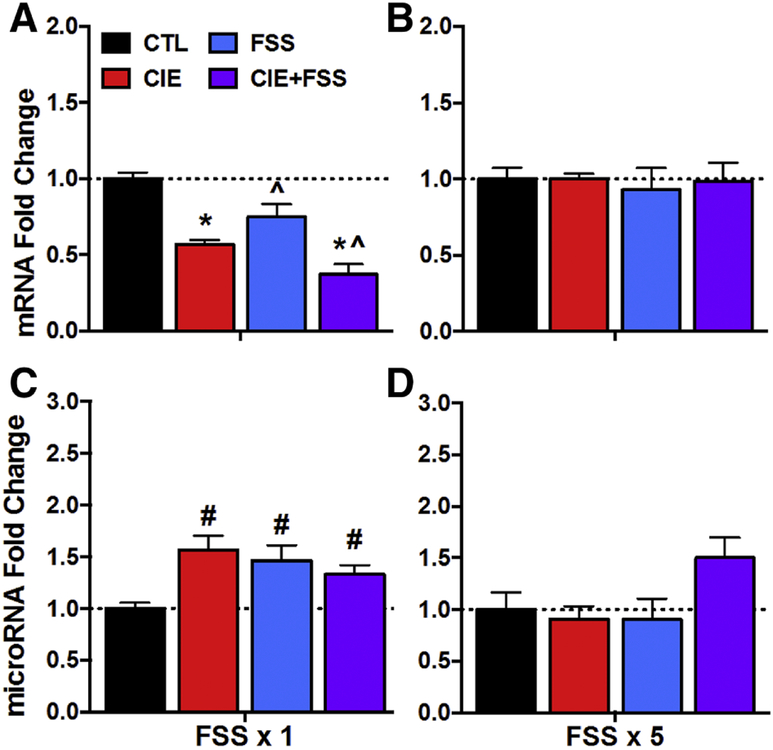
Figure 4: Bdnf mRNA and miR-206 Expression in HPC.
Bdnf mRNA fold change for CTL, CIE, FSS, and CIE+FSS groups (N= 8–10/group) following (A) a single FSS challenge (or 3-days post-CIE exposure) or following (B) five consecutive daily FSS sessions (or 7-days post-CIE exposure). miR-206 fold change for CTL, CIE, FSS, and CIE+FSS groups (N= 7–10/group) following (C) a single FSS challenge (or 3-days post-CIE exposure) or following (D) five consecutive daily FSS sessions (or 7-days post-CIE exposure). Values are mean ± s.e.m. expression fold change relative to CTL group. Main effect of CIE (*, p< 0.01); Main effect of Stress (^, p< 0.01); CIE x Stress interaction: significantly differs from CTL group (#; p< 0.05).

