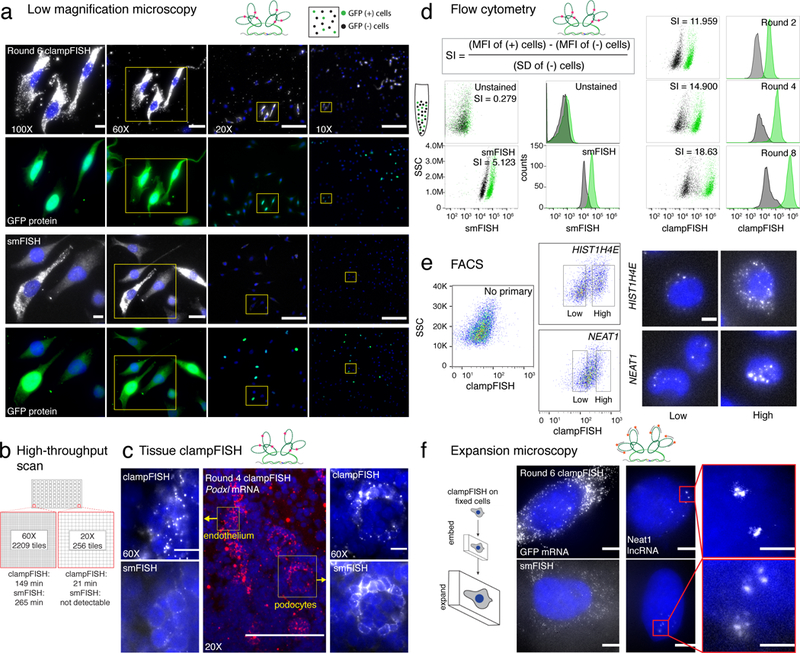
Figure 2.

Applications of clampFISH amplification of RNA. (a) ClampFISH applied to detect GFP mRNA in a mixed population of WM983b cells and WM983b cells stably expressing GFP (top) and compared to GFP smFISH (bottom) using 0.3 NA 10X, 0.5 NA 20X, 1.4 NA 60X and 1.4 NA 100X magnification objectives (representative images of 2-independent experiments; each image is contrasted independently; scale bars are 10 μm for 100X and 60X images, 5 μm for 20X images and 2.5 μm for 10X images). Each image has a corresponding image showing GFP mRNA signal colocalizing with GFP protein. (b) Speed of image acquisition for a scan of an individual well from a 96-well plate equivalent. clampFISH at round 6 was compared to that of smFISH at 20X and 60X magnifications. (c) (center) 20X image of fixed-frozen 5 μm 4do mouse kidney section stained with round 4 clampFISH probes targeting Podxl. (left) 60X image of mouth endothelium by round 4 clampFISH and by single molecule RNA FISH. (right) 60X image of podocyte by round 4 clampFISH and by single molecule RNA FISH (representative images shown of 2-independent experiments). (d) clampFISH was applied to a mixed population of MDA-MB 231 cells with and without GFP expression and analyzed by flow cytometry across 8 rounds of amplification. Cells were gated on GFP expression and are displayed in green. (e) HIST1H4E mRNA and NEAT1 lncRNA were amplified to 6 rounds with clampFISH probes on HeLa cells and cells were separated using a flow sorter. High and low expressers were collected and imaged by microscopy (scale bar is 20 μm). (f) (top) Fluorescent micrographs of round 6 clampFISH targeting GFP mRNA and Neat1 lncRNA in cultured WM983b-GFP cells (bottom) fluorescent micrographs of single molecule RNA FISH targeting GFP mRNA and NEAT1 lncRNA in cultured WM983b-GFP cells using the same dye (images representative of 2-independent experiments; scale bars are 20 μm for the images, and 5 μm for the inlay).
