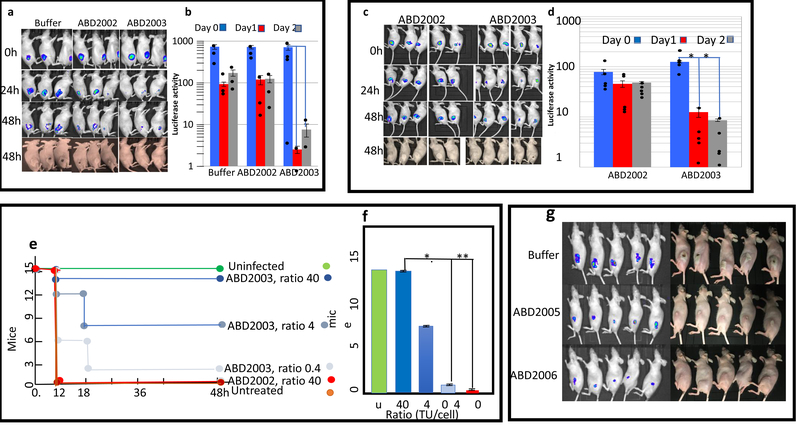
Figure 3. (a,b) Blocking of subcutaneous (SC) murine infections by ABDs.
Bacteria, 4×10⁸, were injected into the SC space of hairless mice through a cannula, followed by 1.2×10⁹ ABD2002 or 2003 particles, through the same cannula. Bacteria were imaged in the in vivo imaging system (IVIS) immediately and after 24 and 48 h. In panel (a) is shown the IVIS images for luciferase activity (Top 3 rows) and photographs of the abscesses of the same mice (bottom row). In panel (b) is shown a quantitative analysis of the luciferase signals. Error bars represent standard errors of the mean, n=3 animals. **P=.01; *P=.05, determined by the one-tailed Fisher’s exact test. Luciferase signals were quantitated using Living Image software (Perkin-Elmer, Inc.). Experiment done once. (c,d) treatment of anbSC murine abscess by IP administration of ABD particles. Mice were injected SC with 4×10⁸ organisms, strain RN1 containing an agrP3::lux fusion, followed immediately by 8.8×10⁹ ABD particles IP. IP treatment with ABD particles at the same dose was repeated 1h later. Mice were imaged in the IVIS immediately afer the first ABD injection, and again after 24 and 48 h. Panel (c) – IVIS images and abscess photographs; panel (d) - quantitative analysis of luciferase signals. Each bar represents the average of the luciferase signals for the five mice in each group at the three time points shown. Error bars represent standard errors of the mean, n=5 animals. Significance was evaluated by the one-tailed Fisher’s exact test; *P=.05. Abscesses at 48 h are the prominent white areas in the mouse flanks – present in all 5 of the ABD2002 mice but in only one of the ABD2003 mice. Difference in abscess formation is significant at the 5% level (P=.0476), one-tailed Fisher’s exact test, n=5 amnimals. Experiment done once. (e, f). Rescue by ABD2003 of mice given a lethal IP dose of staphylococci. Groups of 5 mice were infected IP with 5×10⁹ RN1 cells.. This was followed immediately by IP injection of different numbers of ABD2003 particles. Mice were monitored for 48h. In panel (e) is shown the time course of mouse deaths; In panel (f) is a graphical representation of the final results, in which the groups of mice were pooled and statistics calculated on the pooled groups. Error bars represent standard deviations for each set of 3 pools; *P=.01; **P=.004, calculated by the one-tailed Fisher’s exact test, n=5. (g) Blockage of abscess formation by an agr-inhibiting ABD. Hairless mice were infected with 4×10⁸ RN1 cells through a teflon cannula, followed immediately by 4×10⁹ ABD particles, either ABD2005 (non-targeting) or ABD2006 (targeting the agrP2P3 promoter region), as indicated. Mice were imaged in the IVIS immediately and after 18 and 42 h. The 42h images are shown. Fishers exact test, on the basis of visualization of abscesses, gave a P value of 0.0079 for ABD2006 vs either ABD2005 or untreated, n=5 animals. Experiment done once.

