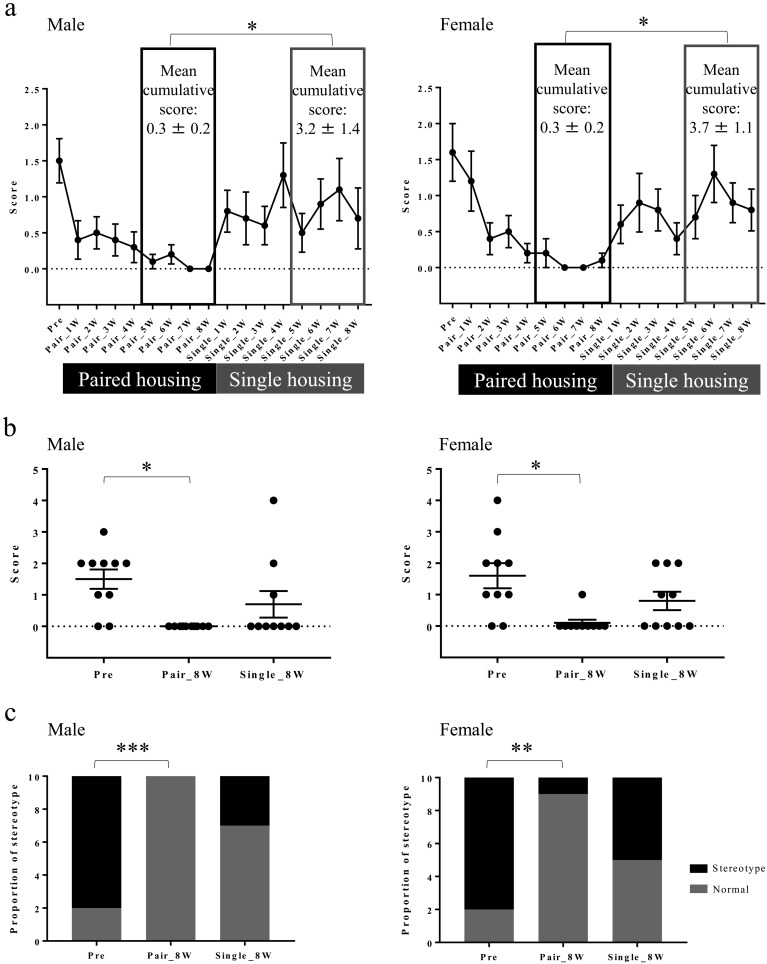
Fig. 3.
Stereotypic behavioral changes in Pre, Pair, and Single. (a) Stereotypic behavioral scores in the Pre, paired housing, and single housing periods at each observation and mean cumulative scores for the latter 4 weeks of Pair and Single (mean ± SEM). *P<0.05 for the latter 4 weeks of Pair vs. the latter 4 weeks of Single (Wilcoxon matched-pairs signed rank test). (b) Stereotypic behavioral scores in Pre, Pair_8W, and Single_8W (mean ± SEM). *P<0.05 for Pair_8W vs. Pre (repeated measures one-way ANOVA and Friedman test with Dunn’s multiple comparisons post hoc test). (c) Proportion of monkeys that displayed stereotypic behaviors in Pre, Pair_8W, and Single_8W. **P<0.01 for Pair_8W vs. Pre in females (Fisher’s exact test). ***P<0.001 for Pair_8W vs. Pre in males (Fisher’s exact test).

