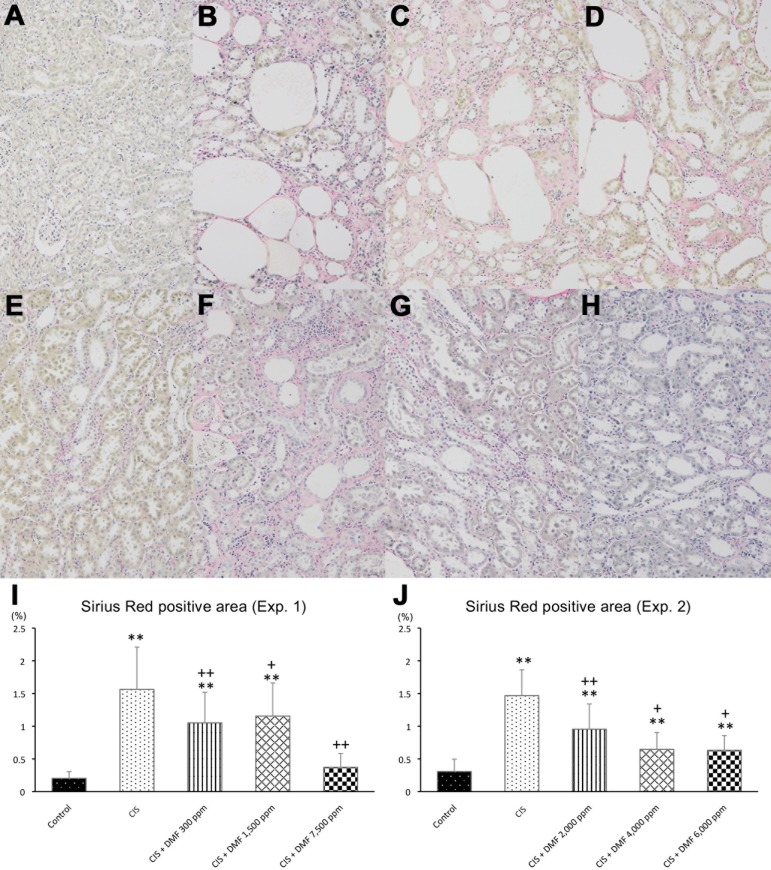
Fig. 3.
Peritubular fibrosis was not observed in the control group (A), but it was prominent in the CIS group (B). In Experiment 1, fibrosis was ameliorated by 300 ppm (C) and 1,500 ppm (D) of DMF, and it recovered to control levels with 7,500 ppm of DMF (E and I). Additionally, in Experiment 2, these changes were dose-dependently ameliorated in all DMF groups (F–H, J). Magnification: ×100 (A–H). Data are expressed as the mean ± SD. **P<0.01 compared with the control group. +P<0.05 compared with the CIS group. ++P<0.01 compared with the CIS group.

