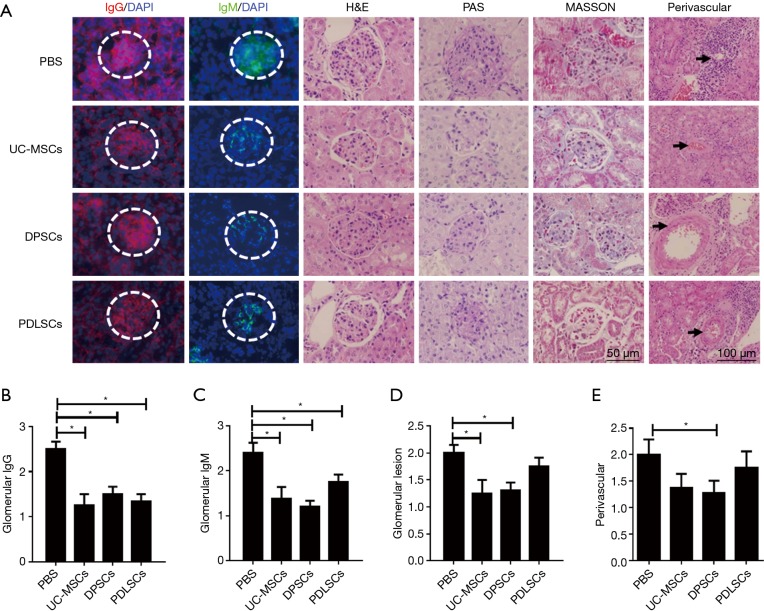
Figure 4.
Renal histopathological changes after transplantation of MSCs. The kidneys were embedded in OCT or paraffin for sectioning. The frozen kidney sections were stained with fluorescein-conjugated IgG and IgM. (A) Representative images of IgG and IgM deposits in glomeruli (original magnification ×40), nephritis with glomerular basal membrane disorder and aberrant mesangial, cell proliferation (HE staining; PAS and MASSON, original magnification ×40), and renal perivascular (original magnification ×20); (B,C) the grade of fluorescence of IgG and IgM; (D) the scores of glomerular pathologies; (E) interstitial inflammation scores. Data are mean ± SEM. PBS (n=8), UC-MSCs (n=8), DPSCs (n=9), PDLSCs (n=8). Statistical comparisons were performed using one-way ANOVA. *P<0.05. MSCs, mesenchymal stem cells; PBS, phosphate buffered saline; UC-MSCs, umbilical cord mesenchymal stem cells; DPSCs, dental pulp stem cells; PDLSCs, periodontal ligament stem cells.

