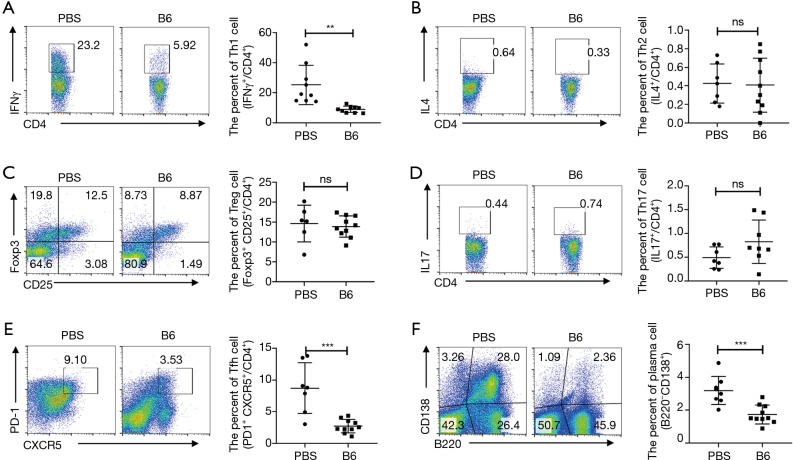
Figure S2.
Flow cytometric analysis of Th1, Th2, Treg, Th17, Tfh and plasma cells in spleens of B6/lpr and B6 mice. Representative flow cytometry data and the percentage show the Th1, Th2, Treg, Th17, Tfh and plasma cells in the spleens between B6/lpr (PBS) and B6 mice. PBS (n=6–9), B6 (n=8–10). **P<0.01, ***P<0.001, Kruskal-Wallis test multiple comparison posttest. PBS, phosphate buffered saline; ns, no significant difference.

