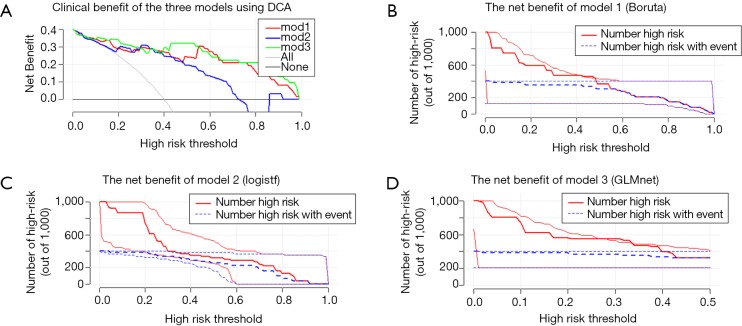
Figure 4.
The difference in the clinical benefit of the 3 models. (A) DCA of the three models. The solid grey line is the net benefit when considering all women at high risk and the horizontal black line when considering no women at high risk. The vertical axis displays a standardized net benefit. DCA showed that model 3 might result in superior net benefits between thresholds of 0.10 and 0.50 for prediction of postoperative PE. (B,C,D) Clinical impact curve for the risk model. Of 1,000 patients, the heavy red solid line shows the total number who would be deemed high risk for each risk threshold. The thin red line shows 95% CI. The blue dashed line shows how many of those would be true positives (cases). The blue thin dashed line shows 95% CI. For example, if a 20% risk threshold was used, then of 1,000 patients screened, about 600 would be deemed high-risk patients in model 1, >600 patients would be deemed so in model 2, and <600 patients would be deemed so in model 3. About 400 of these true PE cases were found in all three models. Model 3 may be superior. DCA, decision curve analysis.

