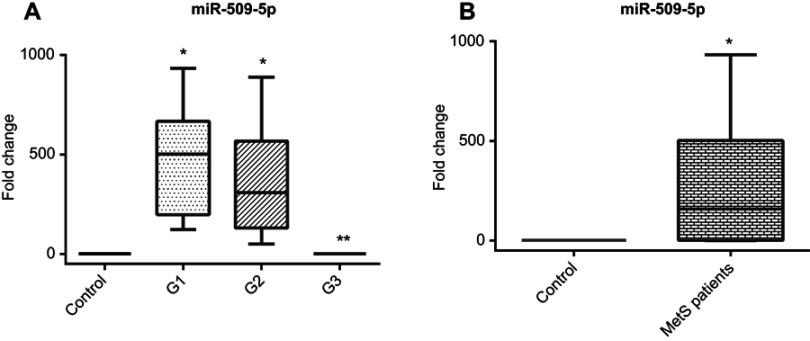
Figure 3.
(A) Serum miR-509-5p relative expression pattern in different MetS groups compared to control group, (B) Serum miR-509-5p relative expression pattern in total MetS cases compared to control group.
Notes: *Significantly different from control subjects at p<0.05. **Significantly different from group 1 and 2 at p<0.05.

