Figure 5.
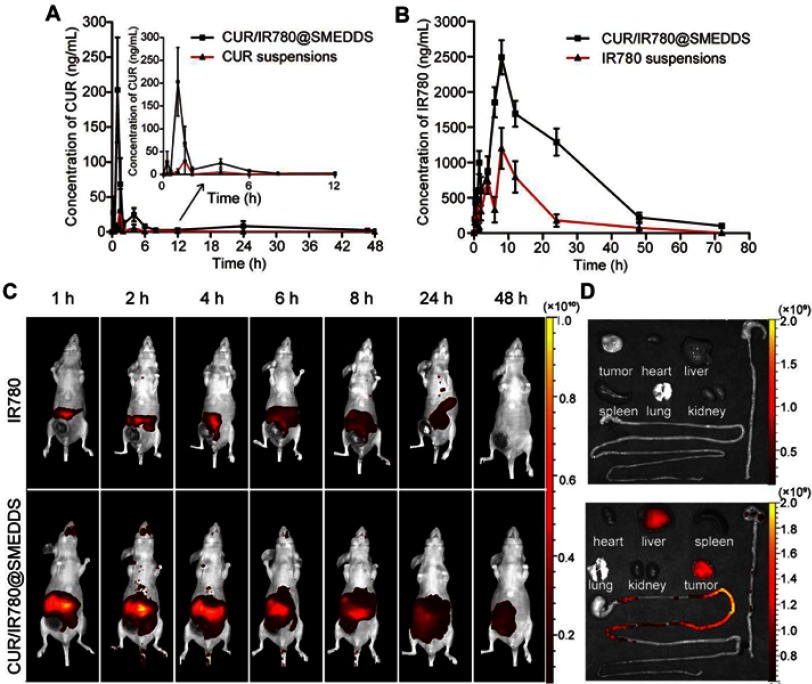
In vivo bioavailability and distribution study. (A) Plasma concentration-time curve of curcumin (CUR) in rats after oral administration of CUR suspensions and CUR/IR780@SMEDDS. (B) Plasma concentration-time curve of IR780 in rats after oral administration of IR780 suspensions and CUR/IR780@SMEDDS. Data are represented as means±SD (n=5). (C) Representative fluorescence images of rats treated with IR780 dispersions and CUR/IR780@SMEDDS at predetermined time points. (D) Representative fluorescence images of isolated tumors and organs, including the gastrointestinal tract.

