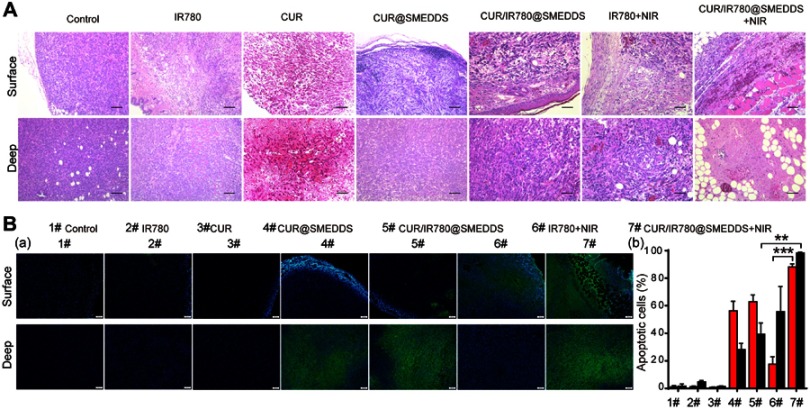
Figure 7.
(A) Histological examination (scale 200 μm) and (B) TUNEL analysis of tumor tissues treated with control, IR780, CUR, CUR@SMEDDS, CUR/IR780@SMEDDS, IR780+NIR, and CUR/IR780@SMEDDS+NIR 16 days after administration. “Surface” and “Deep” labeled rows represent H&E images of superficial and deep tumor tissue regions, respectively. (a) TUNEL assay images and (b) quantitative analysis of fluorescence intensity in apoptotic cells (mean±SD, n=5).

