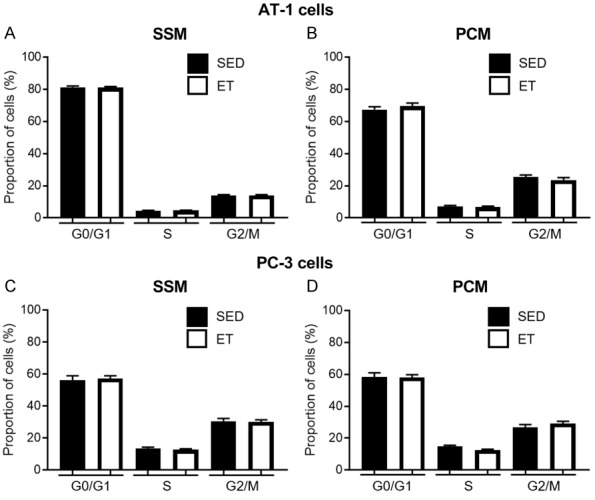
Figure 6.

Bar graph representing the percentage of cells in G0/G1, S, and G2/M cell cycle phase after treatment of AT-1 cells with serum-supplemented media (SSM; A) and prostate-conditioned media (PCM; B) from sedentary (SED; n = 5-10) and exercise-trained (ET; n = 9-10) Copenhagen rats, or PC-3 cells (in normoxia) with SSM (C) and PCM (D) from SED (n = 4) and ET (n = 6) Nude rats. There was no significant effect of media type on AT-1 or PC-3 cell population in different cell cycle phase, in SED vs. ET rats (P > 0.05). Values are expressed as mean proportion of cells (%) ± SEM.
